STAT 360 - Lecture 17
What we will cover today:
- Random Sampling
- Some Important Statistics
- Sampling Distributions
- Sampling Distribution of Means
- The Central Limit Theorem (CLT)
Populations and Samples
Now from the perspective of Random Variables.
- Population $\Leftrightarrow$ Random Variable. For instance, if $X\sim N(65,5)$ represents the heights of 200 people we are studying, then we have a normal population.
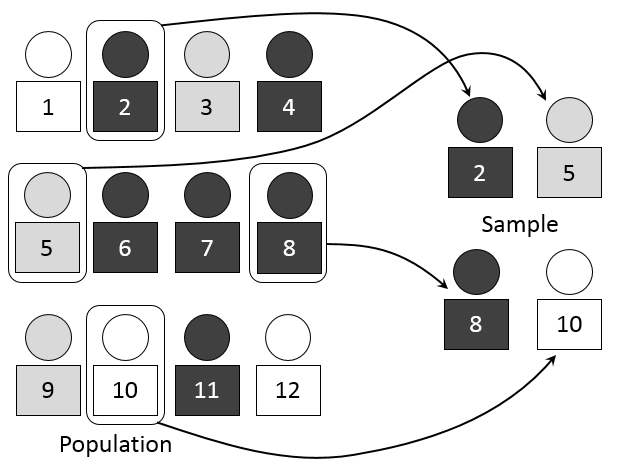
- Sample: a subset of the population, ideally random, usually labeled and unordered.
Random Samples and Statistics
- Random Samples from a distribution $f(x)$ have the i.i.d. property - independent and identically distributed. This means that for a random sample of size $n$ from a population $X\sim f(x; \hat{\theta})$, we have that $X_1 \sim f(x; \hat{\theta}), \dots, X_n \sim f(x; \hat{\theta})$.
- Statistics: a real valued function of the sample $t(x_1, \dots, x_n)$, which does not depend on any unknown parameters.
Example of Statistics: The Sample Mean
Let $X_1, \dots, X_n$ be a random sample, $$\bar{X} = \frac{1}{n}\sum_{i=1}^{n}X_i.$$Example of Statistics: The Sample Variance
Let $X_1, \dots, X_n$ be a random sample, $$S^2 = \frac{1}{n-1}\sum_{i=1}^{n}(X_i - \bar{X})^2.$$Question
Let $X_1, \dots, X_n$ be a random sample from $X \sim f(x)$, then what is the joint pdf for $f(x_1,\dots , x_n)$?
Answer: $f(x_1,\dots , x_n) = f(x_1)f(x_2)\dots f(x_n)$
Question
Let $X_1, \dots, X_n$ be a random sample from $X \sim f(x)$ and $E(X) = \mu$, then is
$$\frac{1}{n}\sum_{i=1}^{n}(x_i - \mu)$$a statistics?
Answer: it depends whether or not $\mu$ is known! If so, yes. If not, no.
With a little bit of algebra, the sample variance $S^2$ of a random sample of size $n$, can be written as:
$$S^2 = \frac{\sum_{i=1}^n X_i^2 - n\bar{X}^2}{n-1}.$$Sampling Distributions
Since a statistic is also a random variable, repeated sampling and observation of a statistic gives us a probability distribution for that statistic.
For example
A large tank of fish from a hatchery is being delivered to the lake. We want to know the average length of the fish in the tank. Instead of measuring all of the fish, we randomly sample twenty fish and use the sample mean to estimate the population mean.
Denote the sample mean of the twenty fish as $\bar{x}_1$. Suppose we take a separate sample of size twenty from the same hatchery. Denote that sample mean as $\bar{x}_2$.
Would $\bar{x}_1$ and $\bar{x}_2$ be the same? Not necessarily.
This would give us the sampling distribution of the sample mean!
In fact we can do this with any statistics, but we will focus on the two most applicable to inference: the sample mean and the sample variance.
Let's do some sampling!
We are going to take a sample, record and plot the mean.
Since this is a new probability distribution, then let's switch to the doc camera and see if we can figure out what its the mean and variance are!
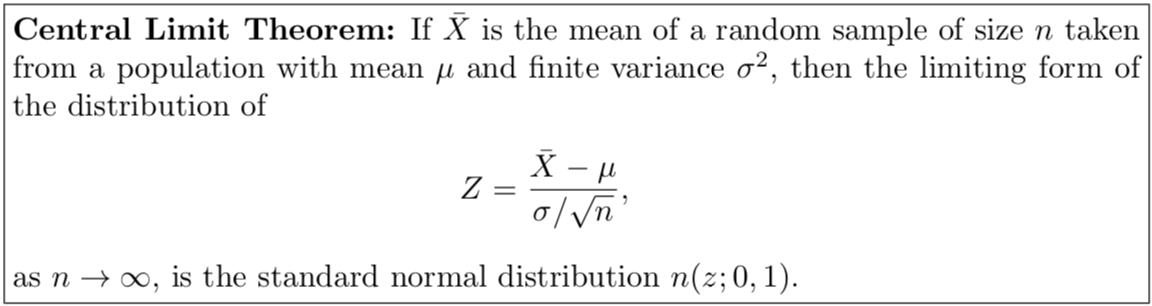
The Central Limit Theorem
R Notebook Demo
CreatureCast - Central Limit Theorem from Casey Dunn on Vimeo.