STAT 360 - Lecture 1
What we will cover today:
- Welcome to Stat 360: Syllabus and Schedule
- Inference, Samples, Populations, and Probability
- Sampling Procedures and Collection of Data
- The Sample Mean and Median
- Measures of Variability
- Discrete and Continuous Data
- Statistical Modeling and Graphical Diagnostics
Welcome to Stat 360: Syllabus and Schedule
SyllabusIntroductions
- Who are you?
- Why are you here?
- What sort of data are you interested in?
Data is everywhere! We are generating data everytime we click a link, go to the doctor, buy a book, take a picture, etc...
There is also data out there that we want to measure: CO$_2$ emissions, energy consumption of electronic devices, people's reaction to a new idea, etc...
So we have data, we can make data, we can collect data...but then what do we do with data?
First we need to make sure we did a good job collecting, organizing and cleaning the data
Then there are two types of analyses we can make on our data:
- Descriptive Statistical Analysis
- Statistical Inference
Descriptive Statistical Analysis
This is a summary of your data, such as the maximum, the average, the standard deviation.
You probably have been doing this sort of data analysis a long time ago. We can gain a lot of insight on a problem just looking at the summary of our data. For instance, the average daily temperatures for a month and a place gives an idea about the weather then and there.
Statistical Inference
This sort of analysis requires us to understand our data more profoundly in order to draw conclusions and make predictions about the larger set of data from which our small sample came from.
For instance, testing the quality of all manufactured motherboards can be time consuming and expensive. The manufacturing process is the same for every motherboard, so we test a sample of 100 and find that 10 out of 100 motherboards have a defect. What can we say about all of the motherboards? What is the confidence of our statement?
Probability will help us here!
Definitions:
- Observation: a unique data point, a realized event, a row on a spreadsheet.
- Sample: a set of observations.
- Population: the larger set from where you sample was taken.
For a statistical problem: sample + inferential statistics (uses probability theory) = conclusion about the population
Probability allows us to draw conclusions about characteristics of hypothetical data taken from the population, based on known features of the population.
$\rightarrow$ deductive reasoning
Sampling and Data Collection
- Simple Random Sampling: any sample of a given size has the same chance of being drawn. Usually random. Samples can be biased, this is not something we want. We may collect stratified samples.
- Experimental Design: Random assignment of different treatment groups. Trying to find causal relationships.
- What happens when we don't make random selections/assignments?
The Sample Mean

The Sample Median

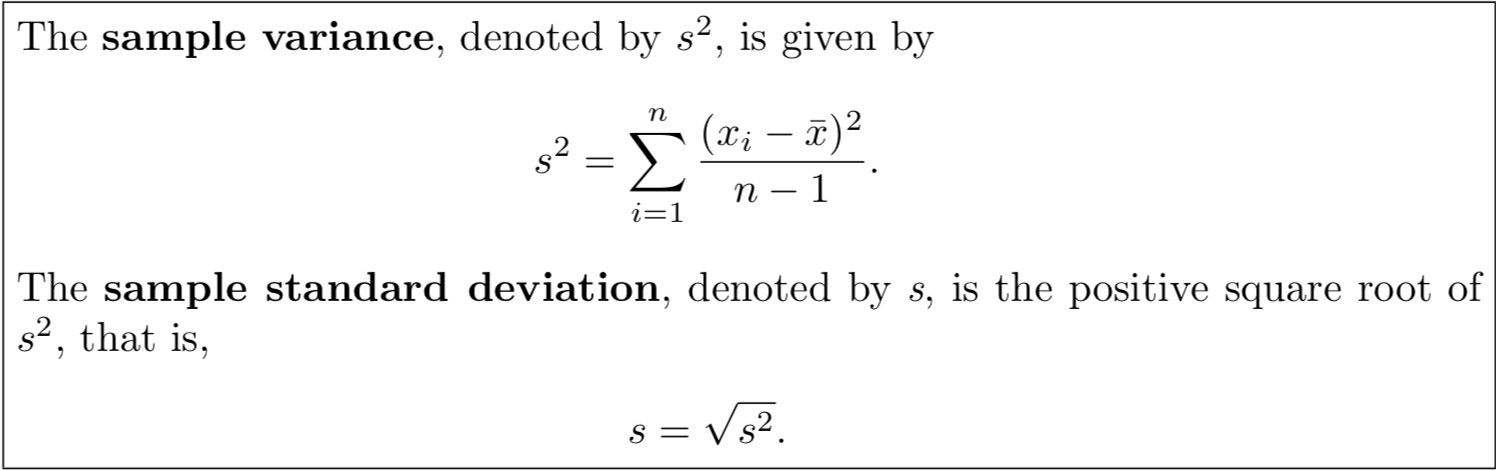
The Sample Variance