Conditional Causal Discovery Interface
Enhancing Convincingness, Variety, and Discoverability
G-RIPS Sendai 2024 | Fujitsu Group
Team: John Forde, Gaspar Mendez, Akane Okubo, Daniel Quigley, Renji Sakamoto
Mentors: Fabiana Ferracina, Jorge Gutierrez, Hiroyuki Higuchi


Left to right: Renji Sakamoto, Akane Okubo, Fabiana Ferracina, Gaspar Mendez, Hiroyuki Higuchi, Jorge Gutierrez, Daniel Quigley, John Forde
Overview
- Problem: Understanding complex causal relationships in data
- Challenge: "Spaghetti graphs" are hard to interpret and compare
- Solution: Interactive interface promoting CVD principles
- Demo: Live walkthrough of the interface
- Future: Extensions and research directions
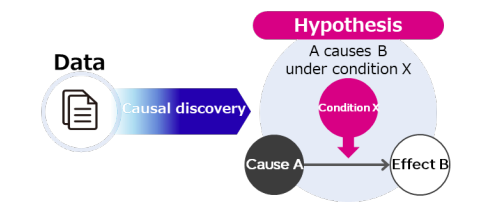
The Causality Challenge
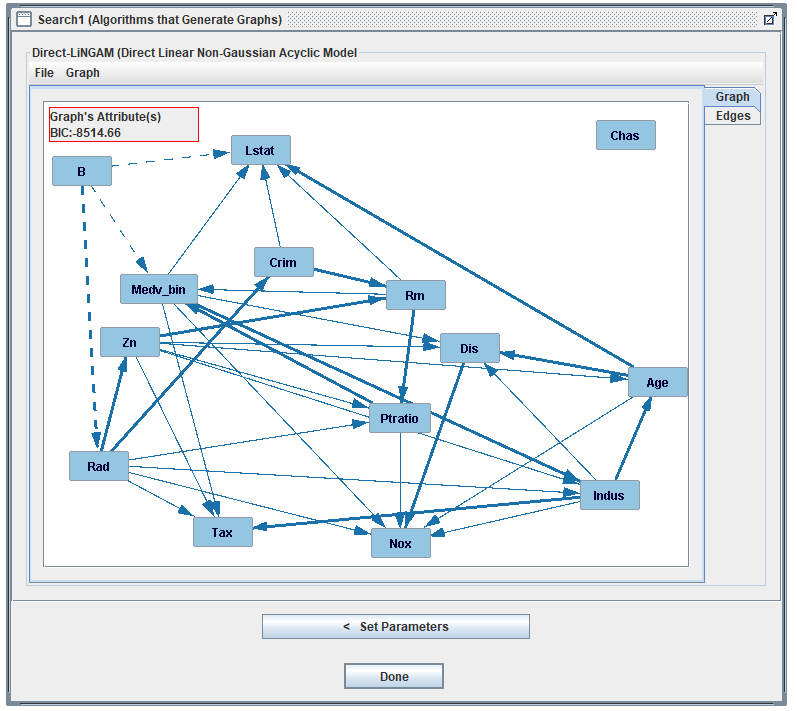
- Traditional approach: Single causal graph (DirectLiNGAM)
- Wide Learning™: Multiple graphs under different conditions
- Problem: Too many graphs to comprehend effectively
The "Spaghetti Graph" Problem
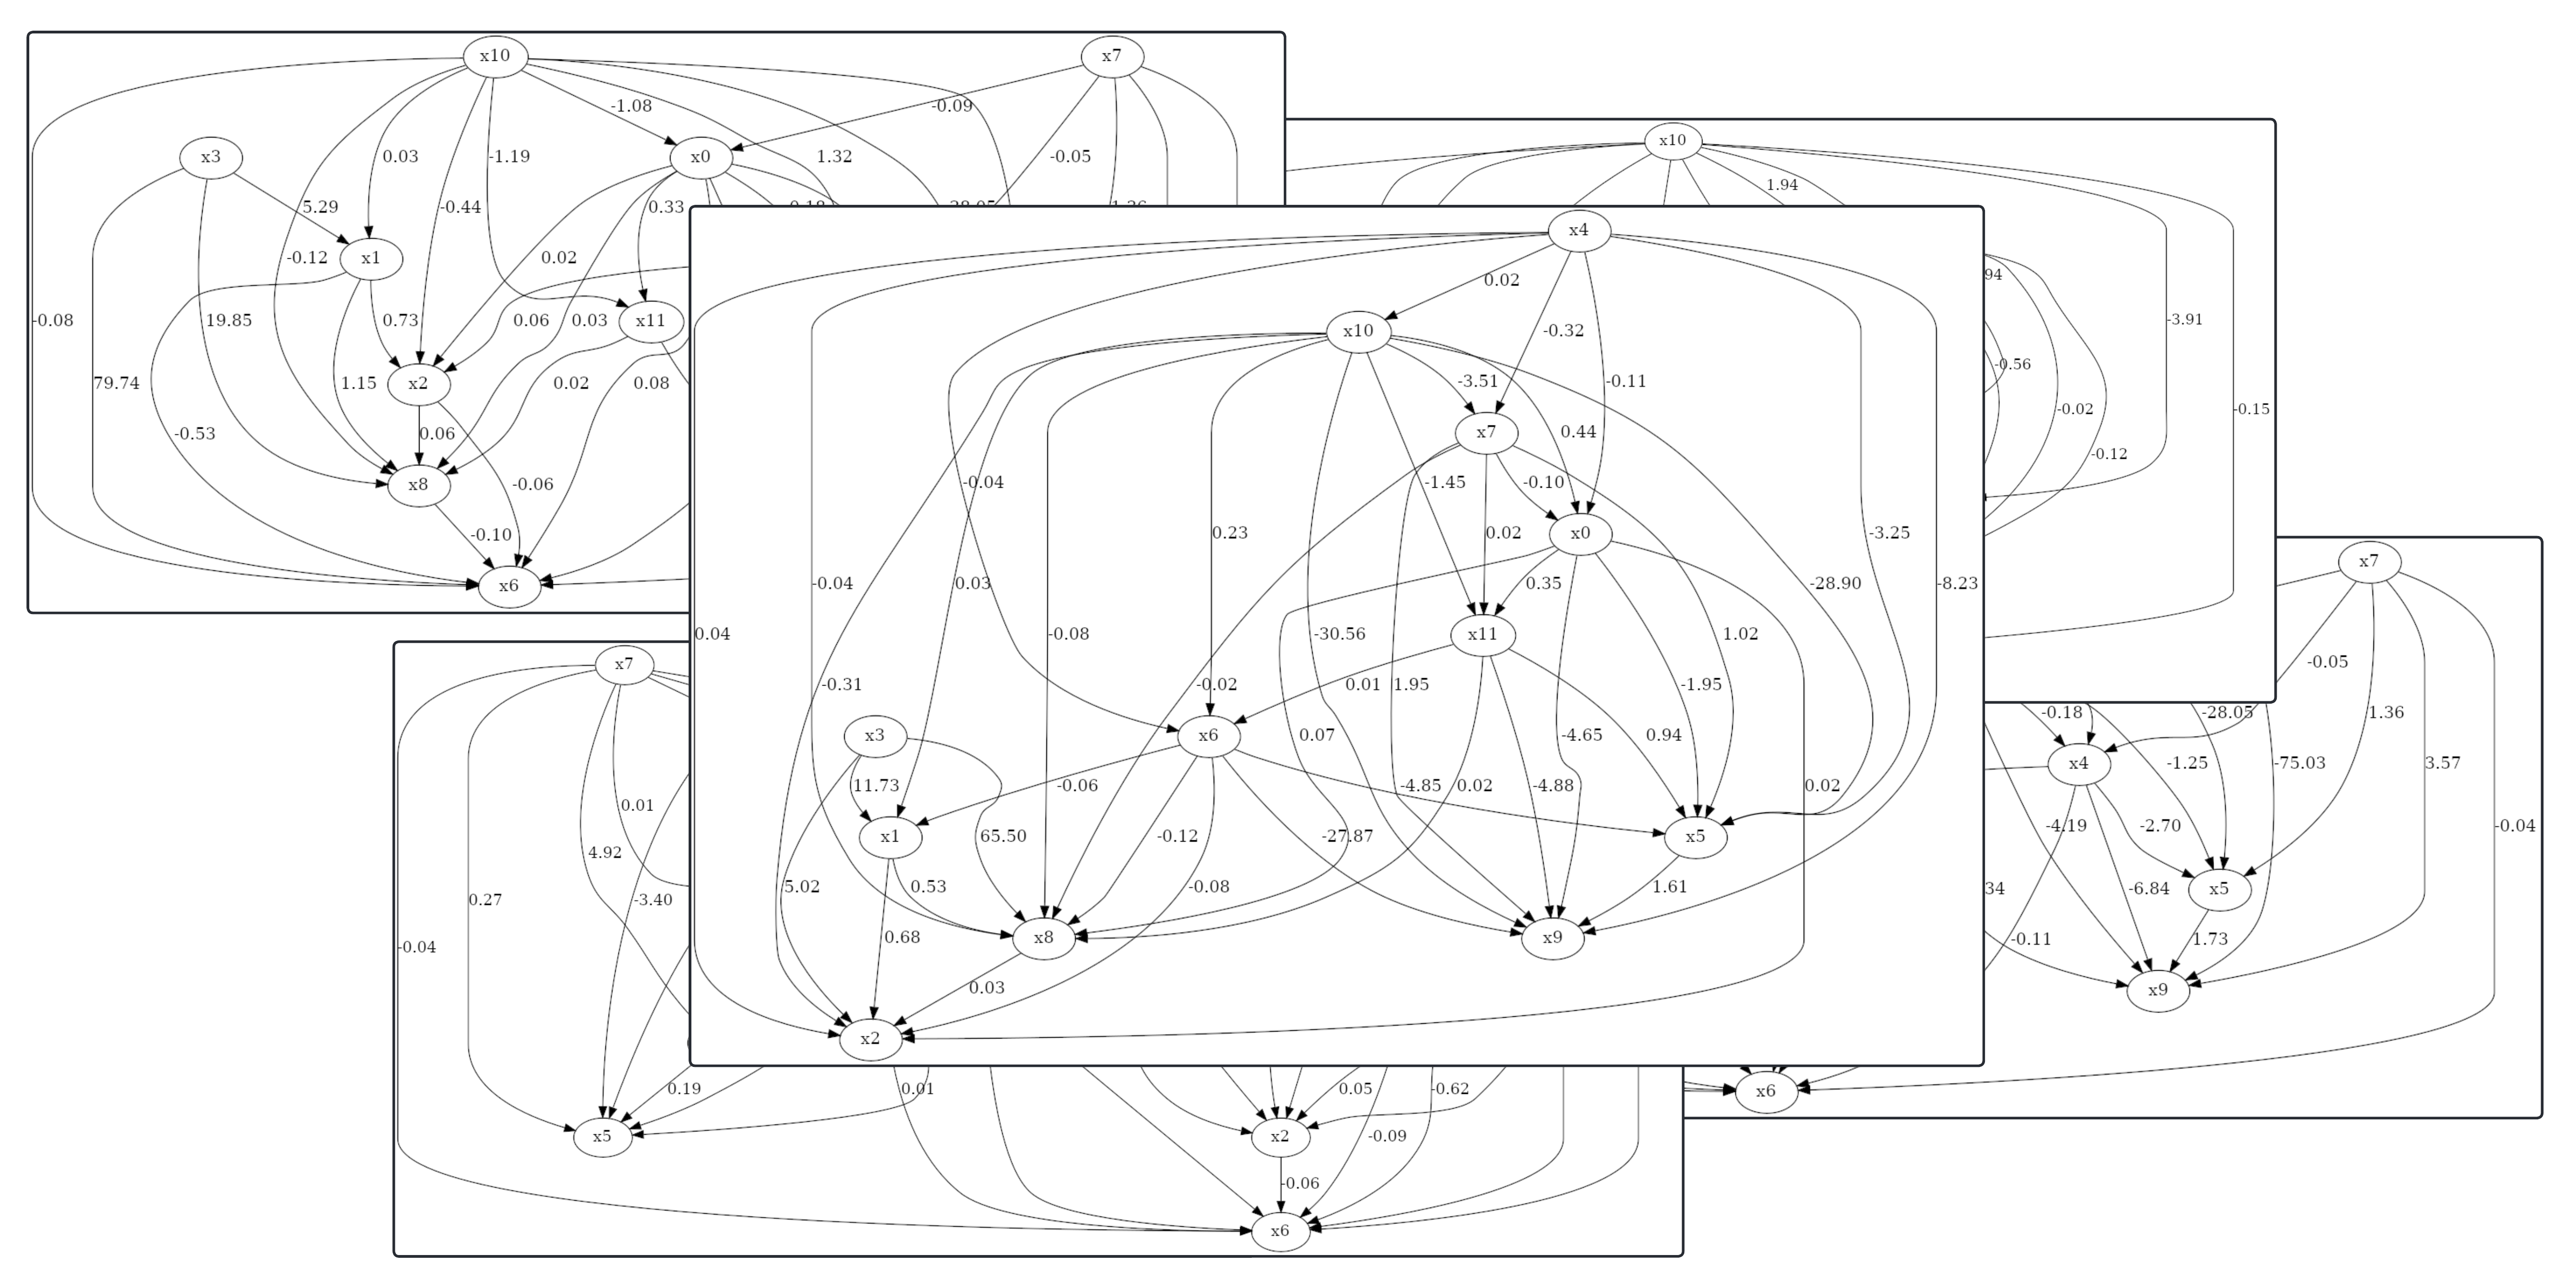
Complex causal graphs are inherently difficult to interpret
CVD: Our Design Framework
Convincingness ↔ Variety ↔ Discoverability
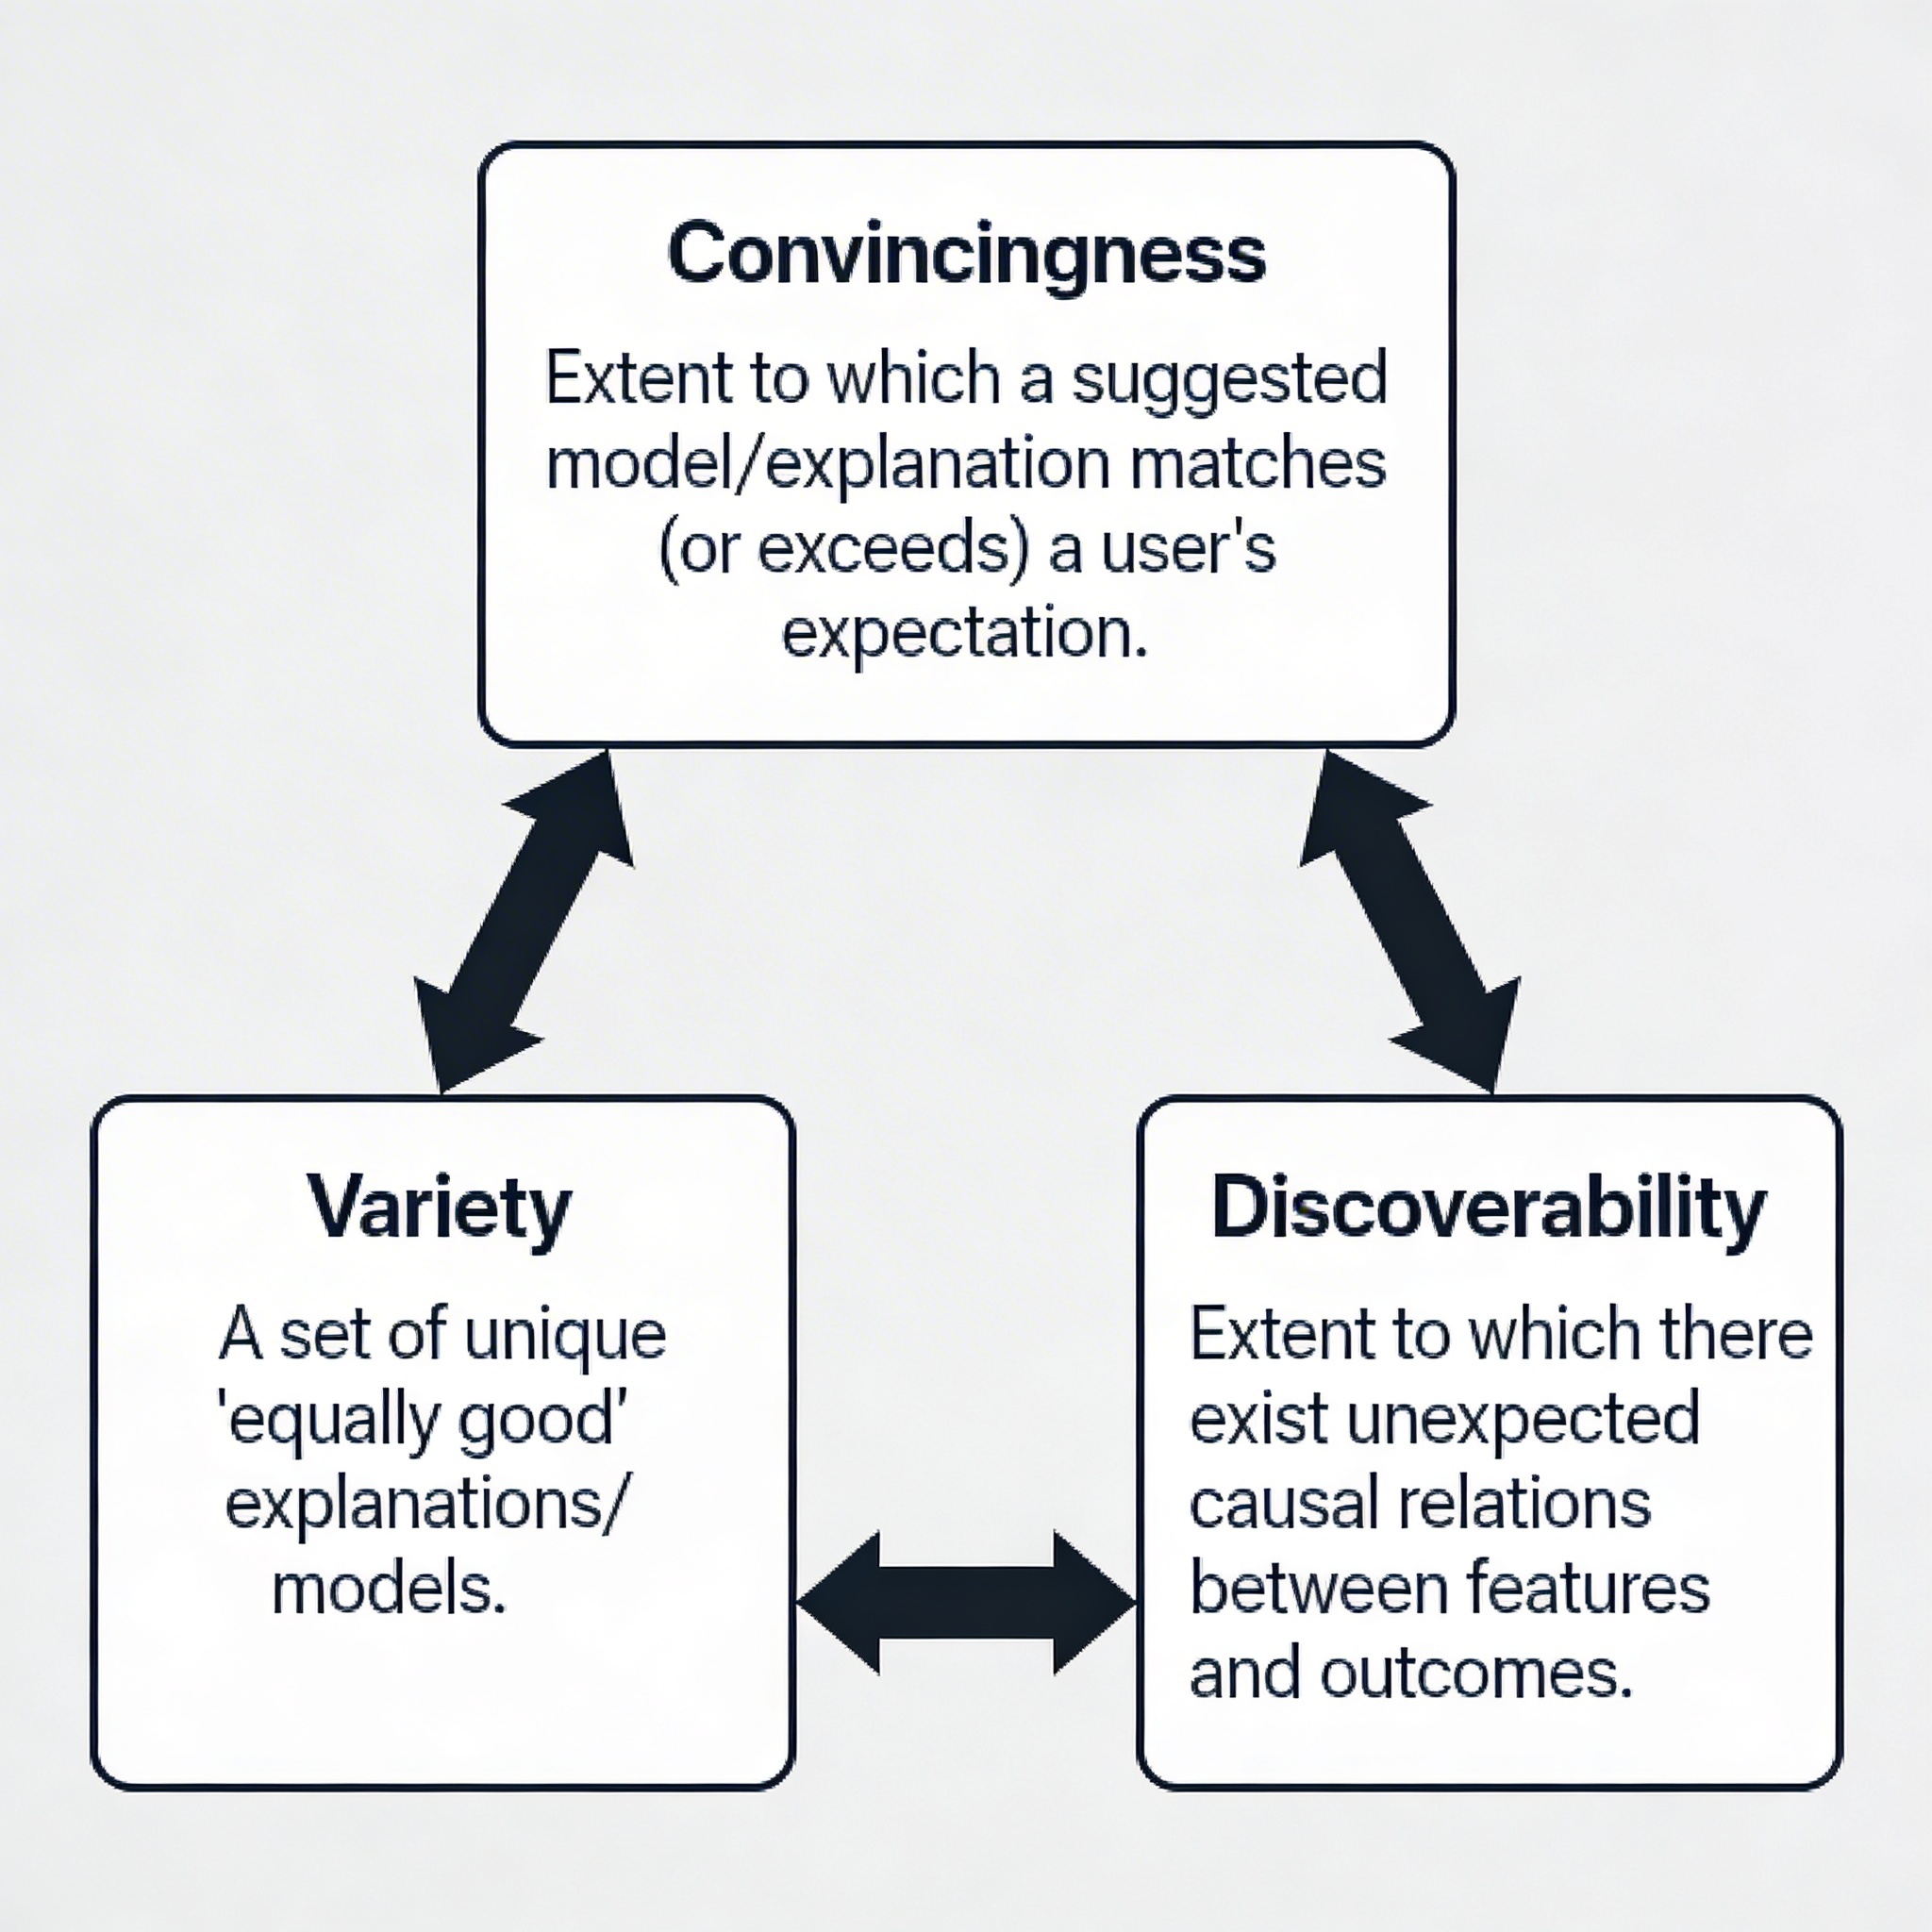
CV/CD/VD
We consider the pairwise interaction of these concepts:
- CV - we explore by explanation of elements of the Rashomon set with similarities
- CD - we explore by understanding how and why these causalities came to be through independent or directed evaluation of evidence
- VD - we explore by choosing elements from the Rashomon set that have new or unexpected results
Understanding the Background and Necessary Tools
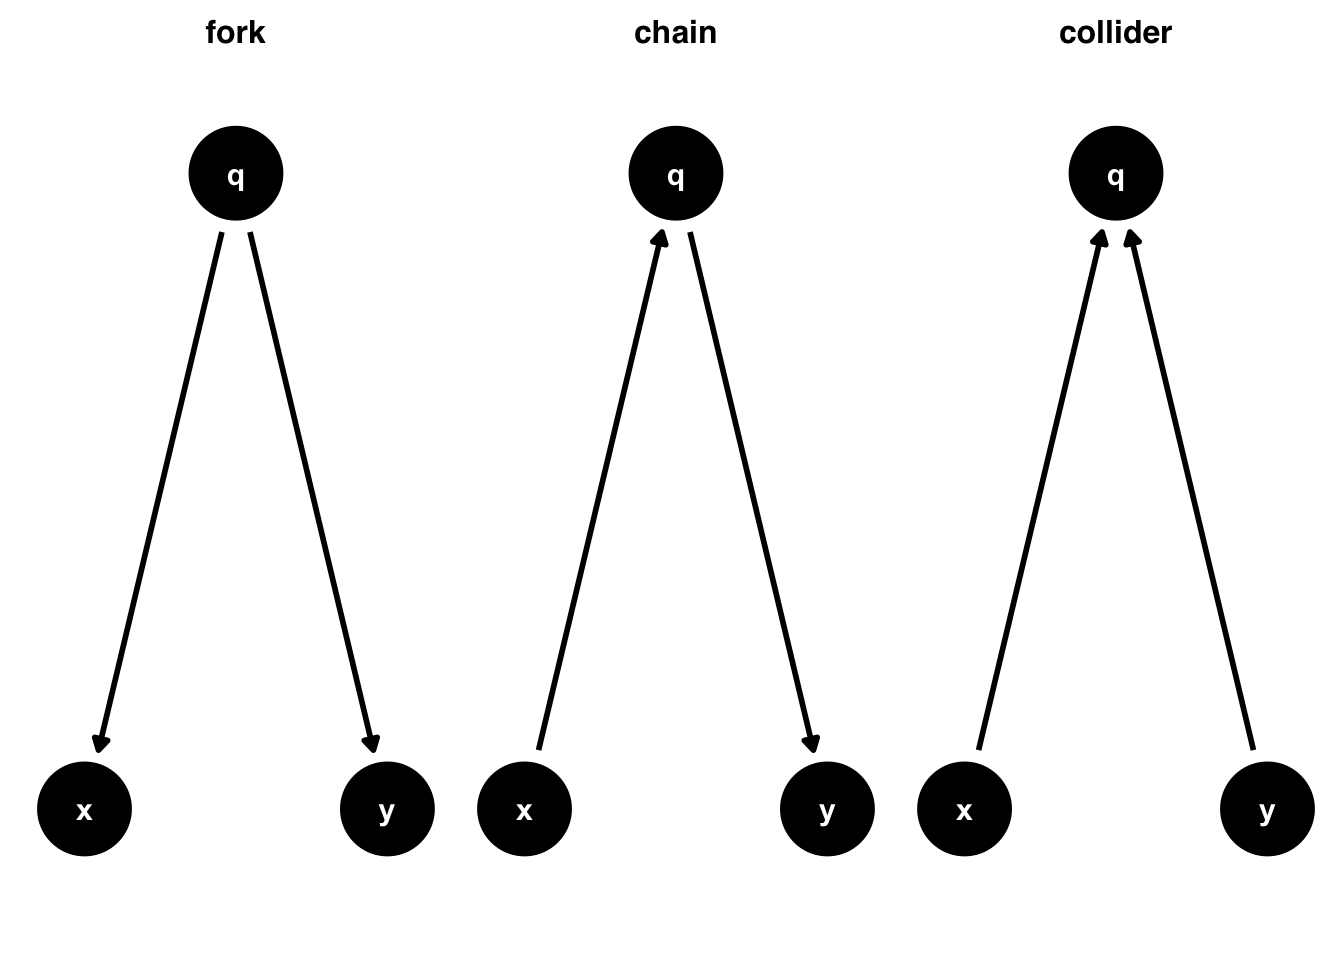
Directed Acyclic Graphs (DAGs)
Mathematical foundation for representing causal structures
- Nodes: Variables in the system
- Directed edges: Causal relationships
- Acyclic: No variable causes itself
- Constraint: Prevents circular causality
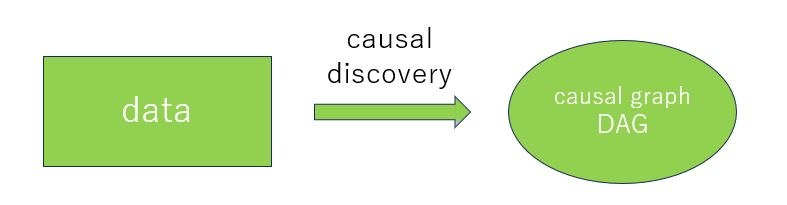
Causal Discovery
Recovering DAG representations from observational data
Key Challenge: Given only probability distributions, you can identify a Markov equivalence class — multiple DAGs that are statistically indistinguishable
Structural Equation Model (SEM)
Structural equation modeling (SEM) is a multivariate statistical framework for specifying and testing systems of relationships among observed and latent variables in a single, integrated model
\(M_{SEM} = (U, V, F, P)\)
- U: Exogenous variables (external factors)
- V: Endogenous variables (observed)
- F: Functions defining relationships
- P: Joint probability distribution
Direct Linear Non-Gaussian Acyclic Model
Resolves ambiguity by exploiting non-Gaussianity
Result: Identifies a unique DAG rather than an equivalence class
- Variables are continuous
- Relationships are linear
- Noise terms are mutually independent
- Noise terms are non-Gaussian
DirectLiNGAM: Algorithm
Iterative process to identify causal ordering
- Find exogenous variables (no parents)
- Test which variable's residuals are most independent
- Remove that variable and repeat
- Build unique causal structure
DirectLiNGAM: Example
Variables: Temperature, Ice Cream Sales, Drowning Deaths
- Step 1: Test all variables — Temperature's residuals are most independent → no parents
- Step 2: Remove Temperature, test remaining — Ice Cream Sales is independent
- Step 3: Only Drowning Deaths left
- Result: Temperature → Ice Cream Sales, Temperature → Drowning Deaths
Both caused by temperature, but don't cause each other!
Wide Learning (WL)
Symbolic classification model for causal discovery
\(M_{WL} = (\text{features}, \text{combinator}, \text{evaluation})\)
Generates multiple causal graphs under different conditions
- Finds all feature combinations (up to \(K \leq 4\))
- Evaluates via mutual information or entropy
- Identifies which combinations contribute to outcome
- Creates condition-specific causal graphs
Wide Learning: Example
Student Performance Study
DirectLiNGAM:
Study hours → Performance (one global graph)
Wide Learning discovers:
- High stress, low sleep: Study hours have little effect
- Low stress, adequate sleep: Study hours strongly affect performance
- With tutoring: Study hours → understanding → performance
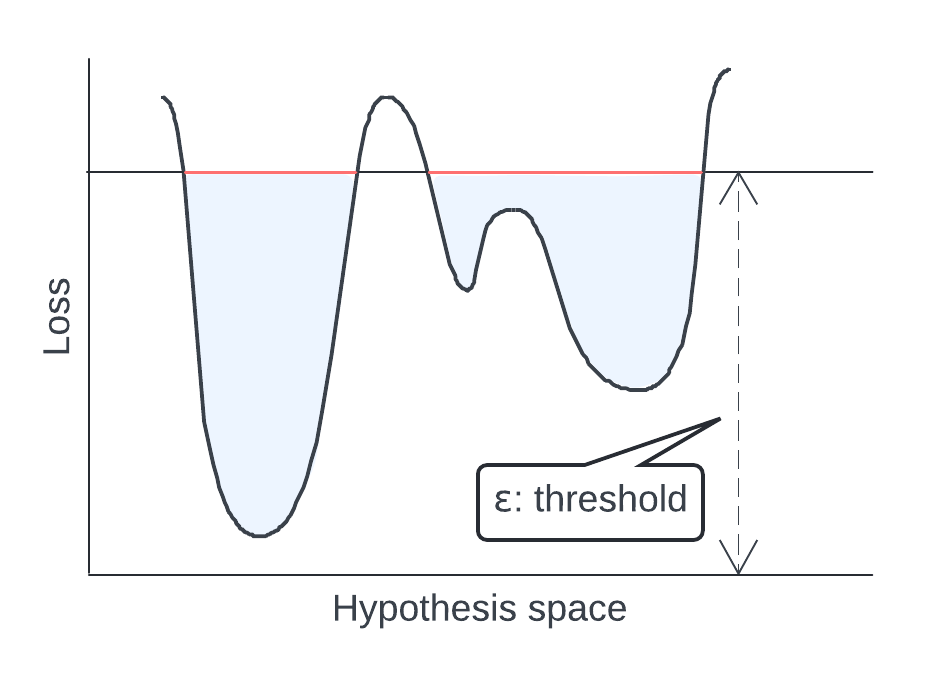
Rashomon Sets
Set of unique, equally good explanations/models
Model Multiplicity: Many structurally different models achieve nearly identical performance
Named after the film where the same event has multiple plausible accounts
Model Evaluation Metrics
Assess fit and select among competing DAG structures
- AIC: Akaike Information Criterion
- CFI: Comparative Fit Index
- RMSEA: Root Mean Square Error of Approximation
AIC: Akaike Information Criterion
\(\text{AIC} = 2k - 2\ln(L)\)
- k: Number of parameters
- L: Likelihood
- Balances fit against complexity
- Lower AIC = better model
CFI & RMSEA
CFI
- Compares model to baseline
- Range: 0 to 1, \(>0.95\) is good fit
RMSEA
- Population fit estimate
- \(<0.06\) indicates good fit
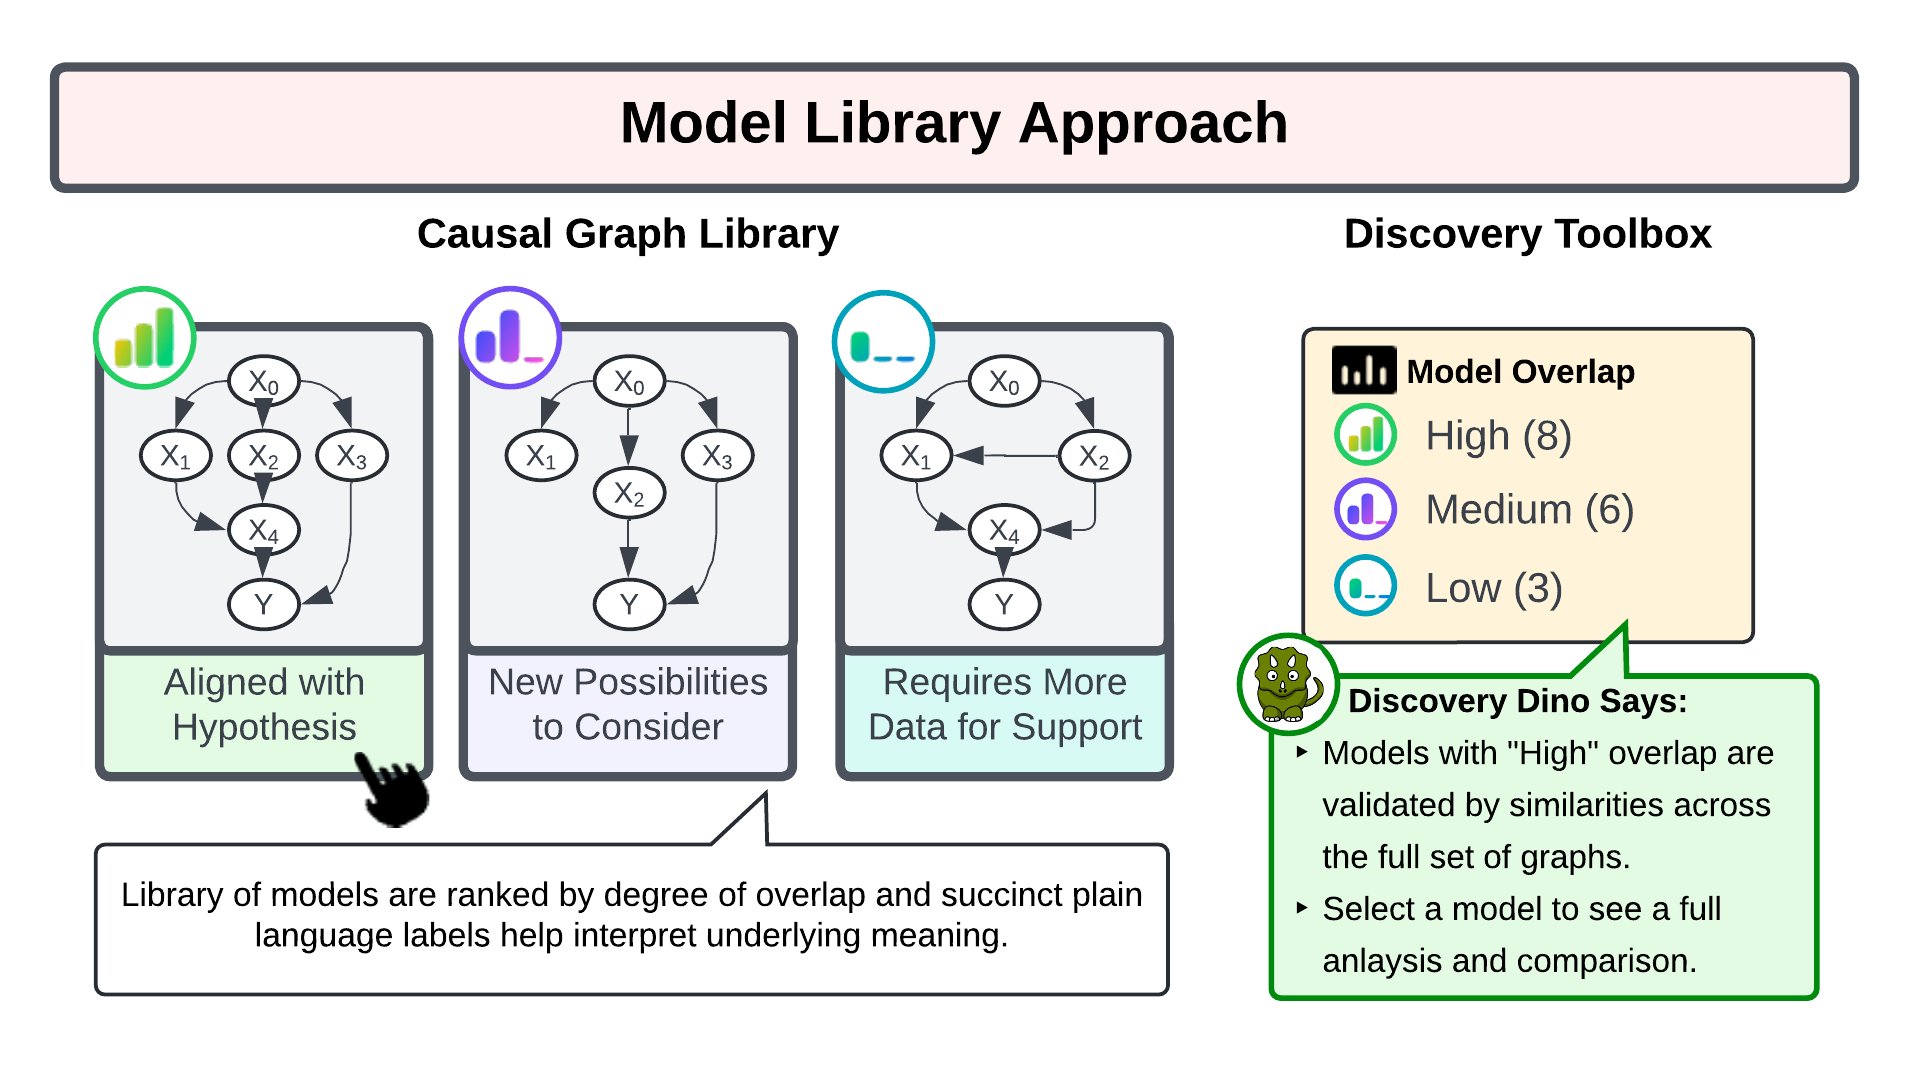
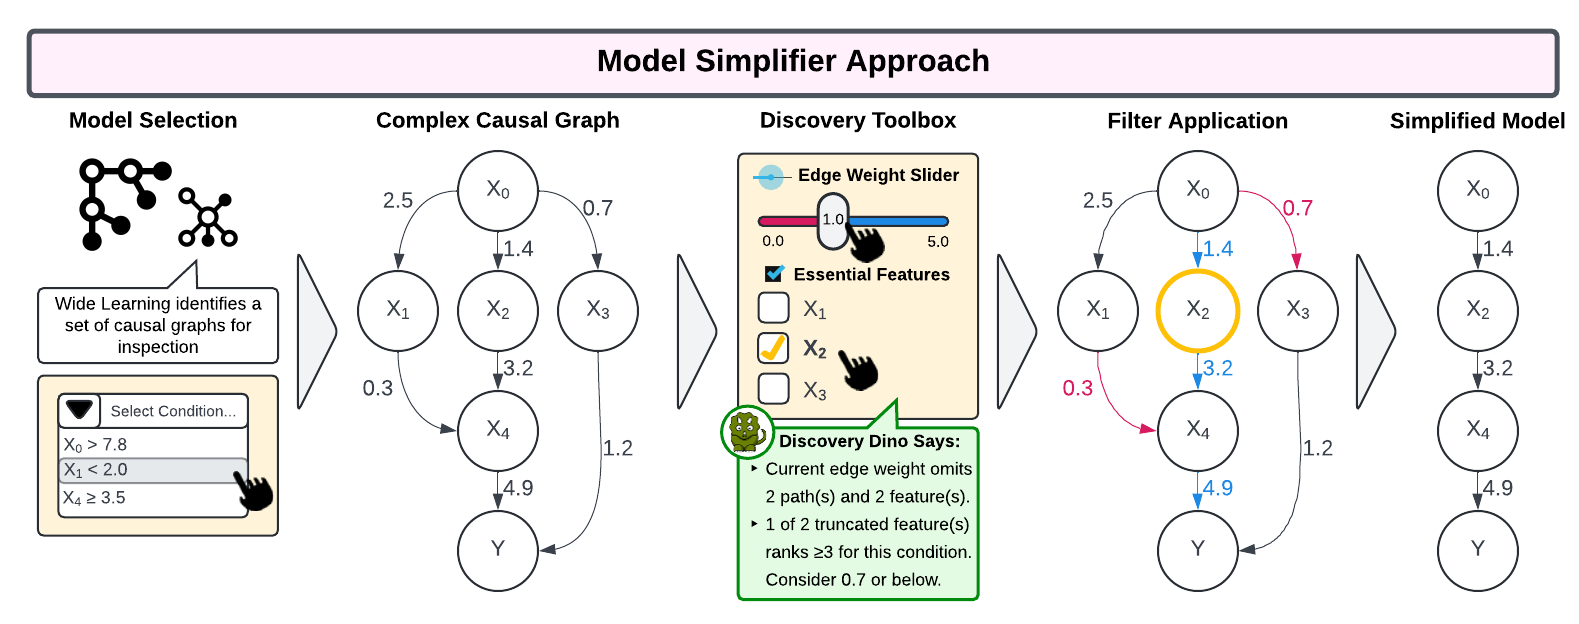
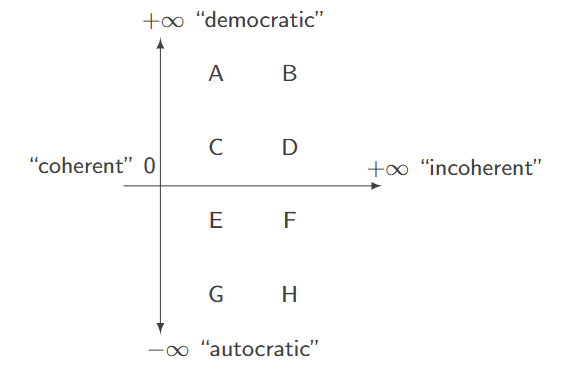
Graph Hierarchies
Solution for navigating spaghetti graphs
- Input: Complex graph structures
- Output: Numerical grades for comparison
- Metrics: Incoherence and Democracy
- Enable discovery by properties
Interface Design Principles
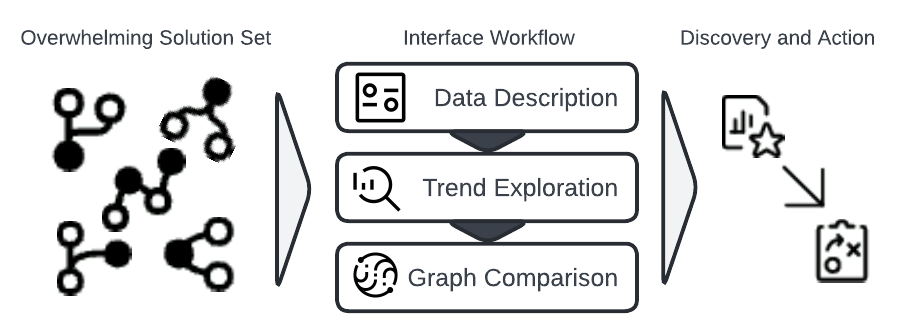
- Minimize overwhelmingness - Present information in digestible subsets
- Storytelling approach - Build understanding progressively
- Guided & unguided discovery - Balance exploration and direction
- Accessibility features - Color, navigation, responsiveness
- "Don't think, feel!" - Intuitive, interactive design
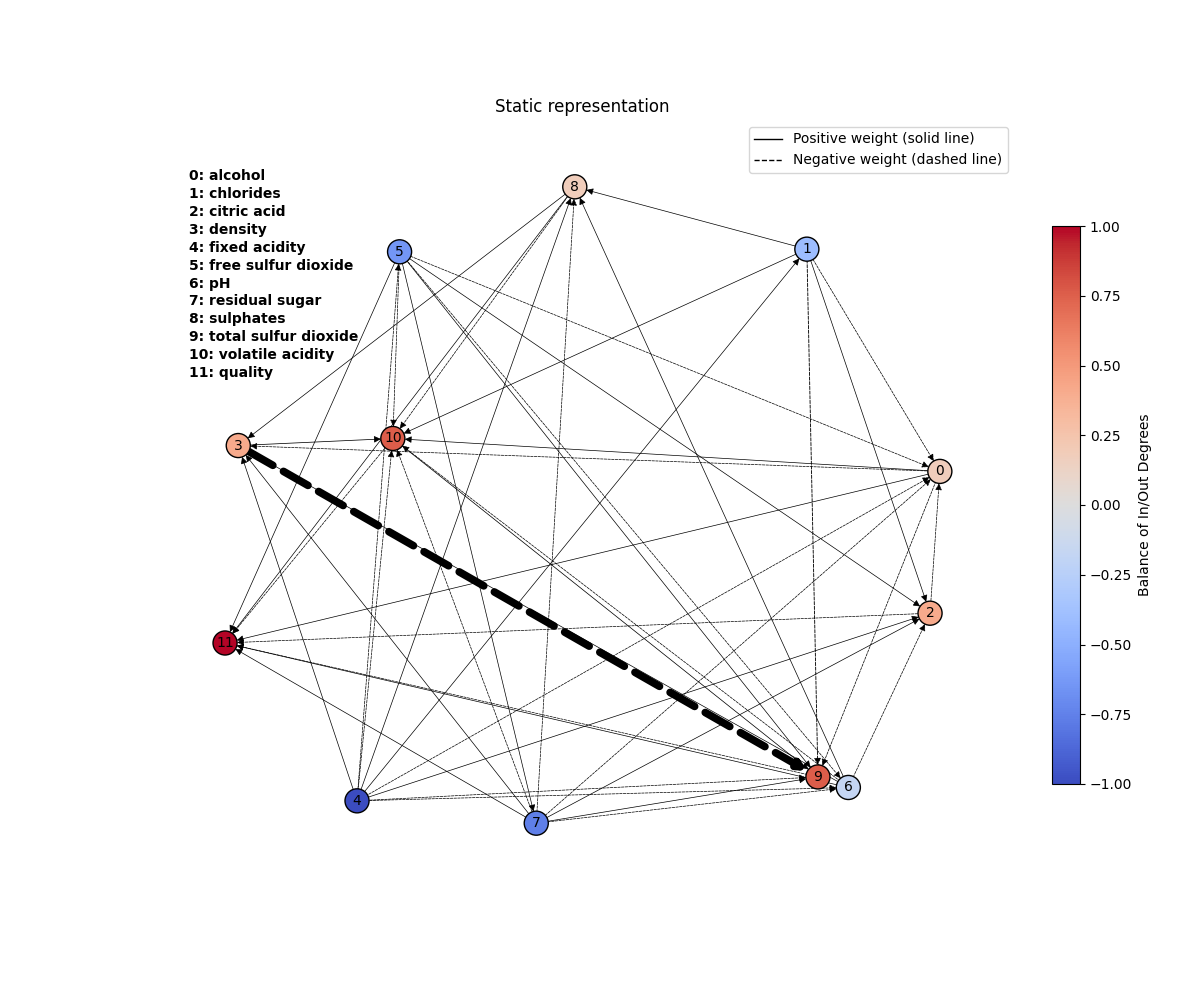
Case Study: Wine Quality
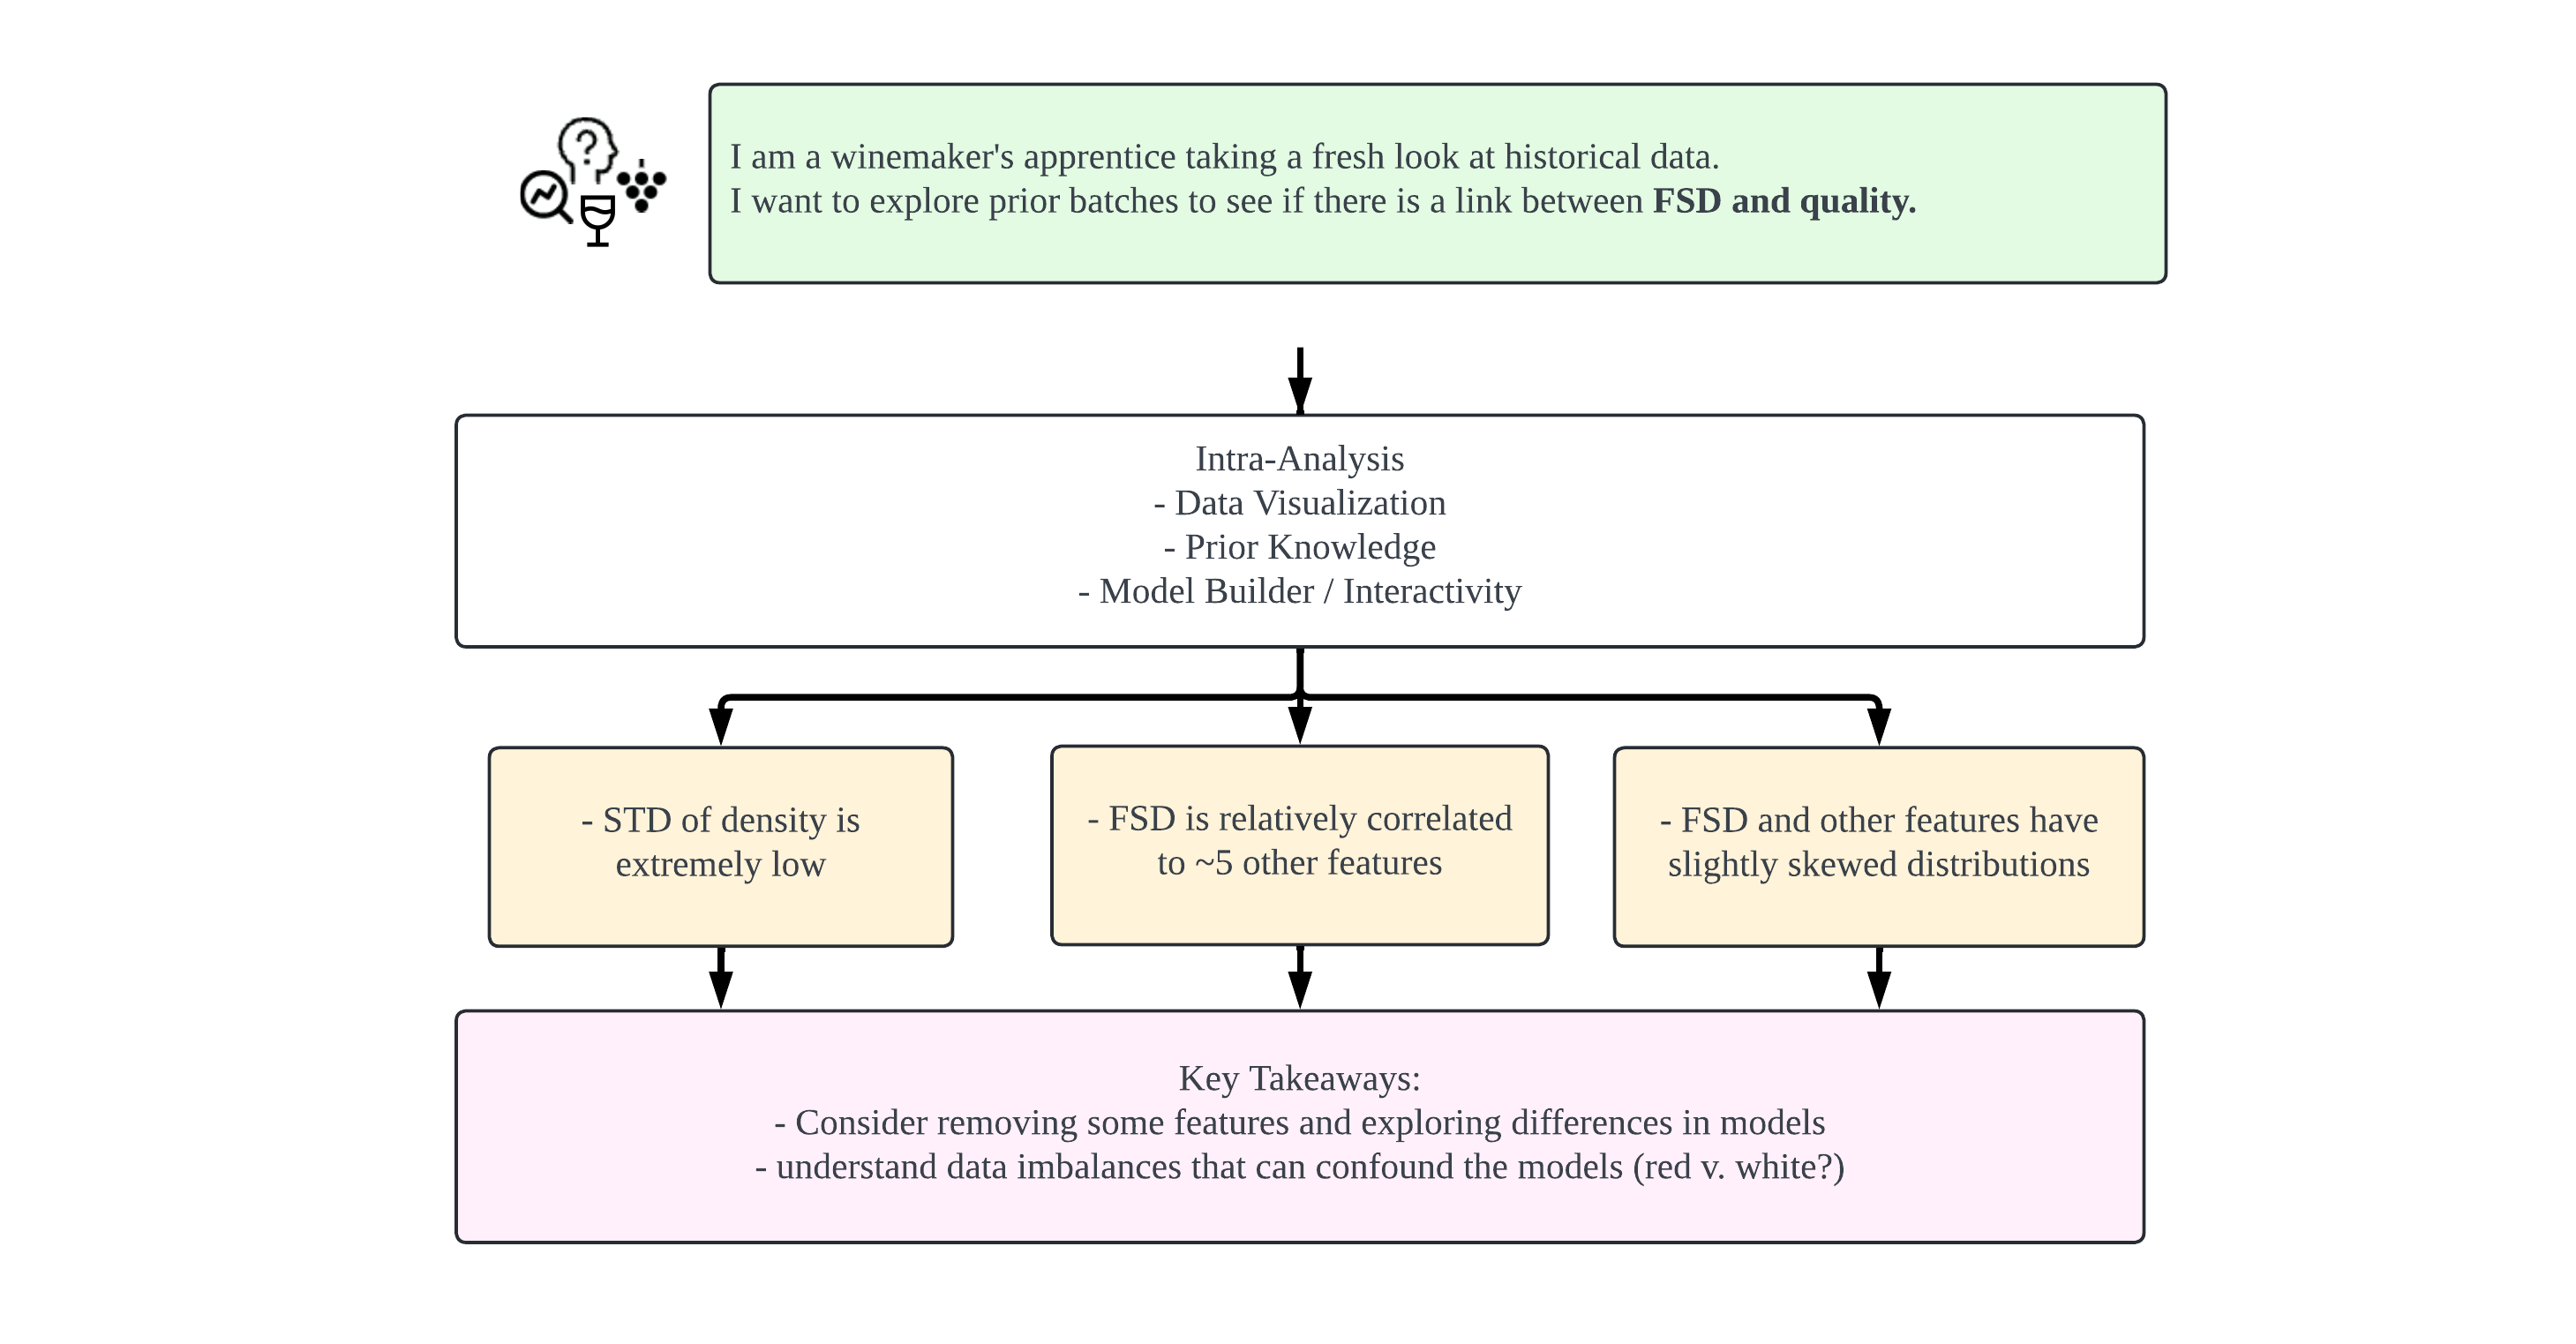
A winemaker's apprentice exploring historical data to understand quality drivers
Feature 1: Data Visualization
- Data cleaning suggestions
- Descriptive statistics
- Correlation analysis (heatmap & scatterplots)
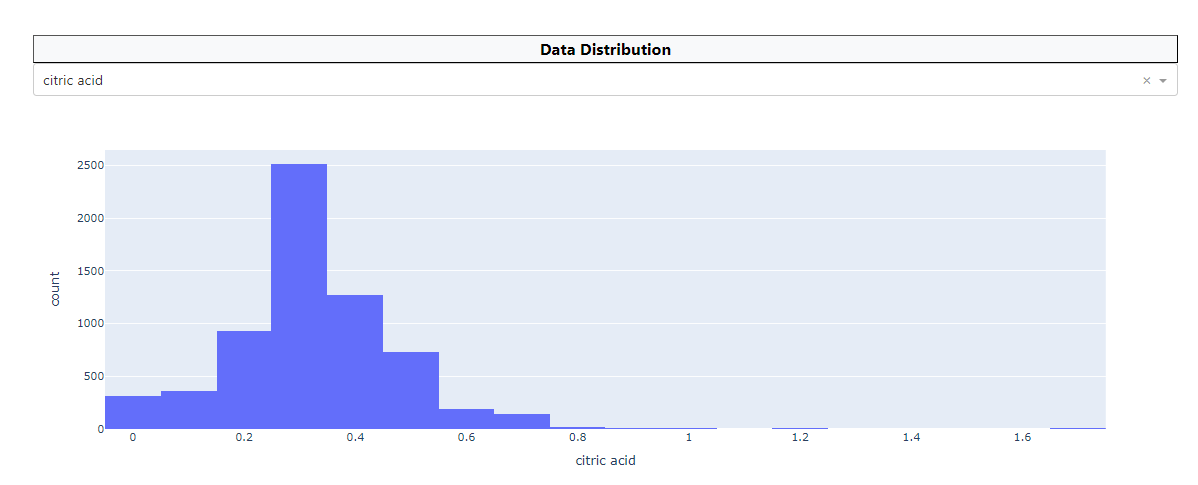
- Distribution histograms
Data Visualization Dashboard
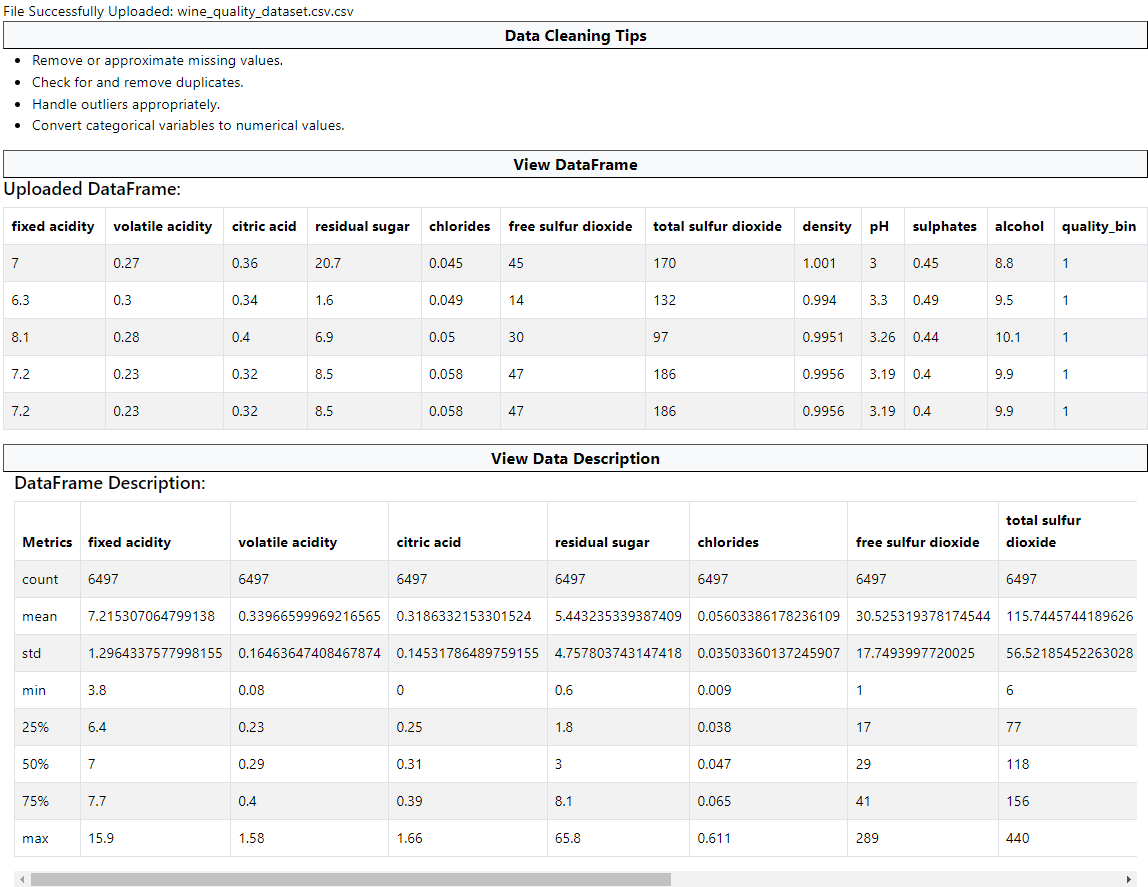
Raw data, descriptive statistics, and data quality checks
Correlation Analysis
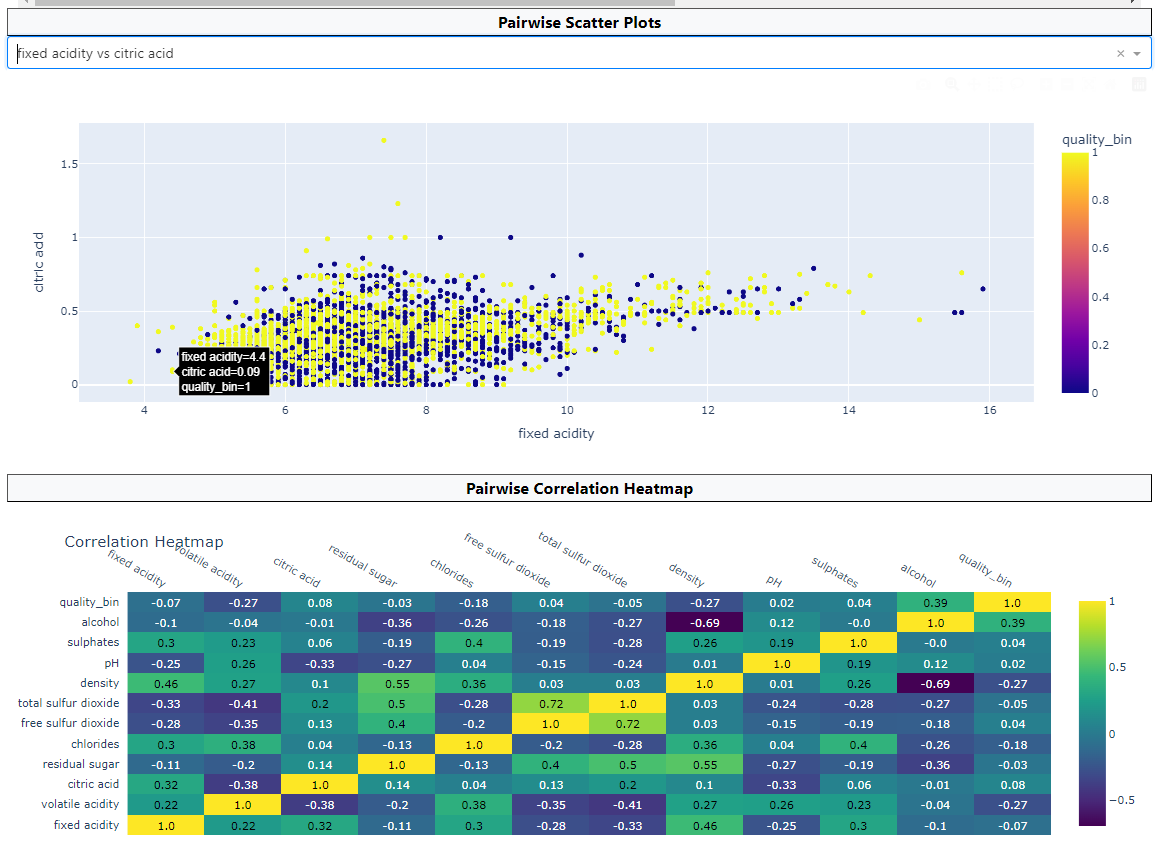
Pairwise correlations revealed through heatmap and scatterplots
Wine Dataset Insights
Feature 2: Prior Knowledge Survey
- -1 (Default): No prior knowledge
- 0 (Add): x causes y (specify sinks/outcomes)
- 1 (Add): y causes x (specify sources/actions)
Prior Knowledge Interface
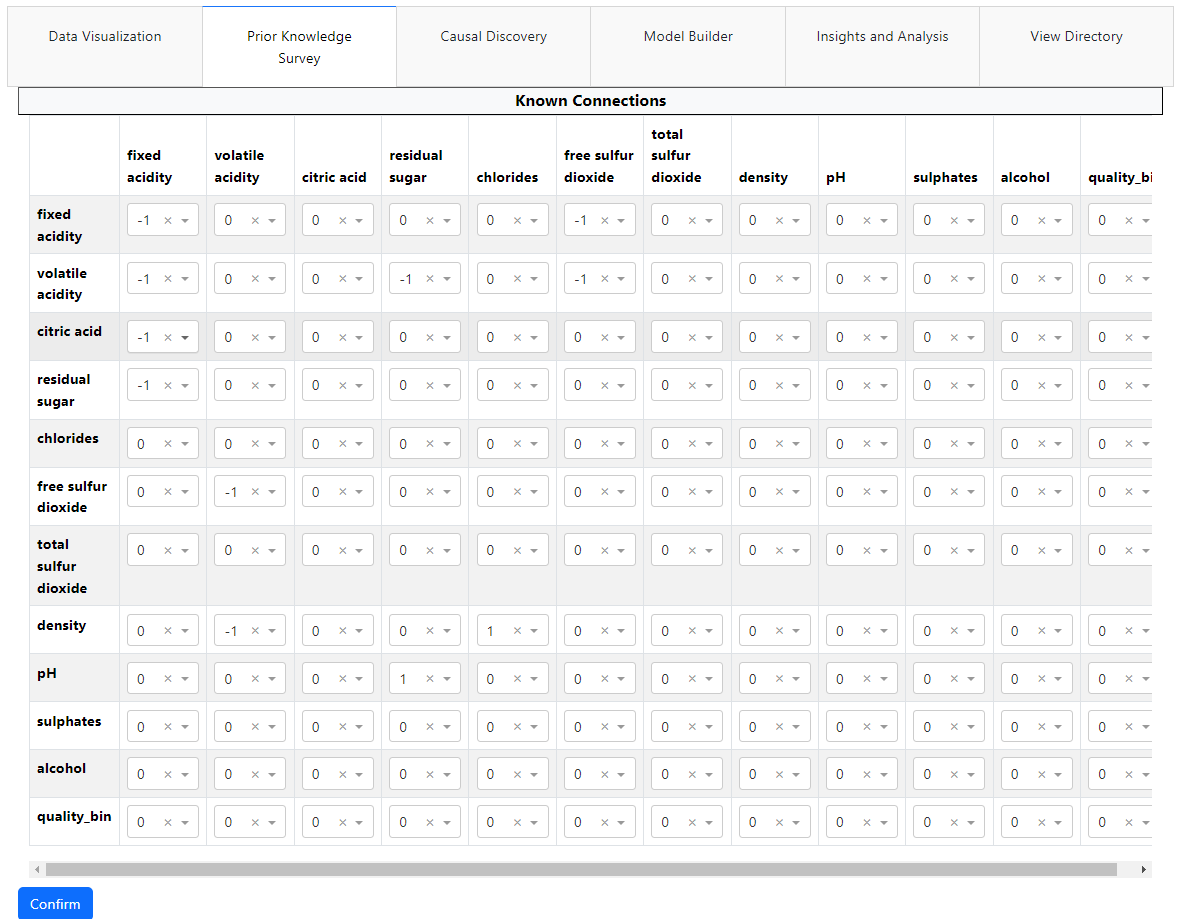
Interactive matrix for specifying causal relationships
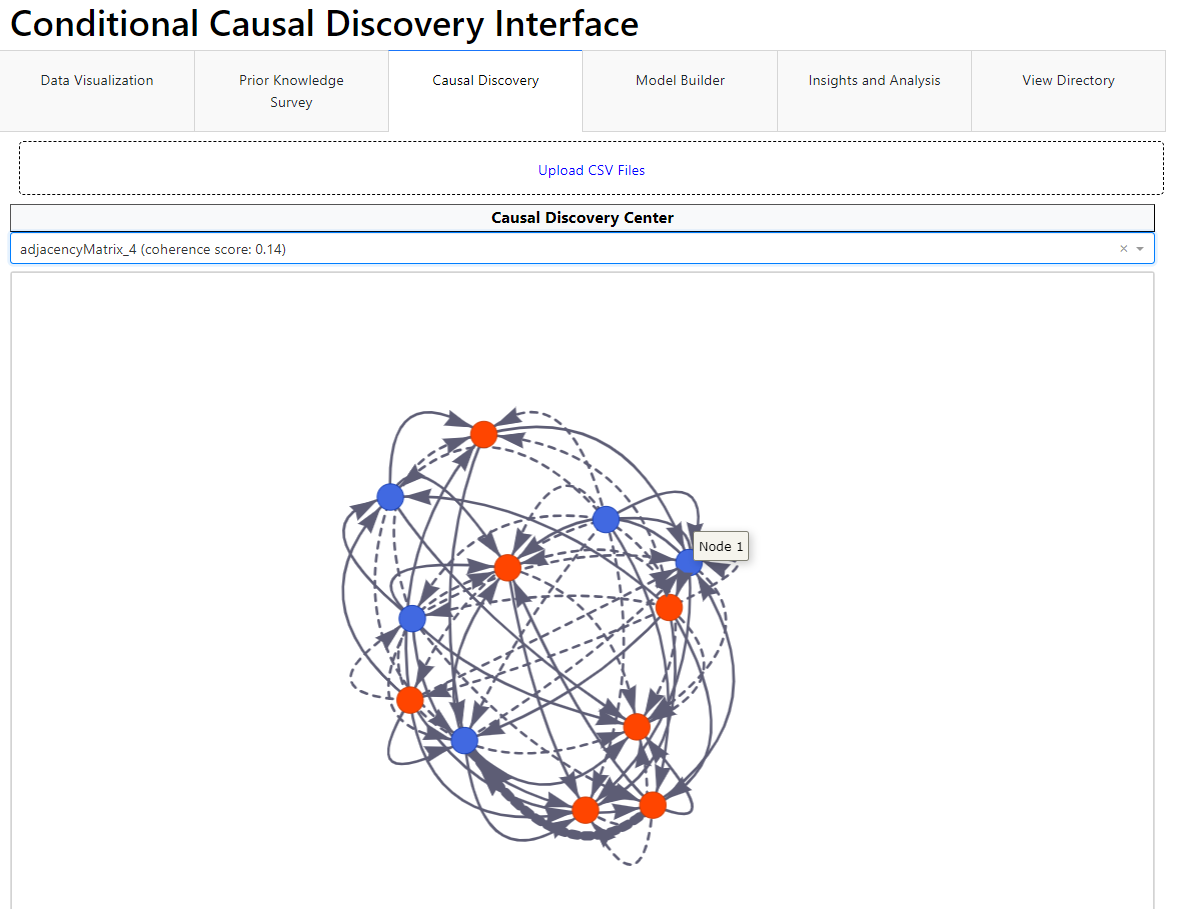
Feature 3: Hierarchical Metrics
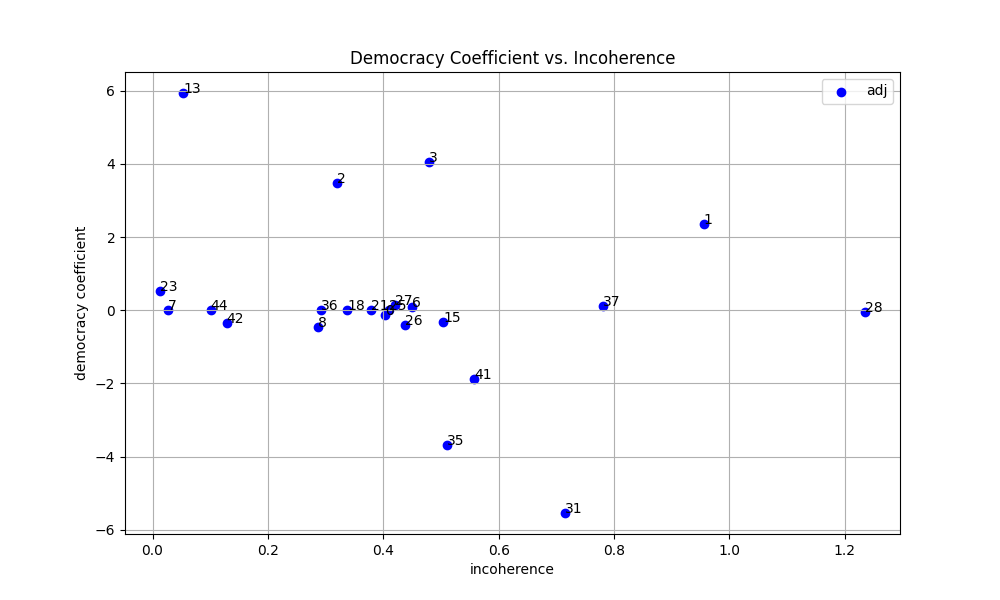
Democracy Coefficient
- Measures "balance" of influence
- High: Many features equally important
- Low: Few features dominate
Incoherence Score
- Measures graph complexity
- High: Many contradictory paths
- Low: Clear, coherent structure
Hierarchical Visualization
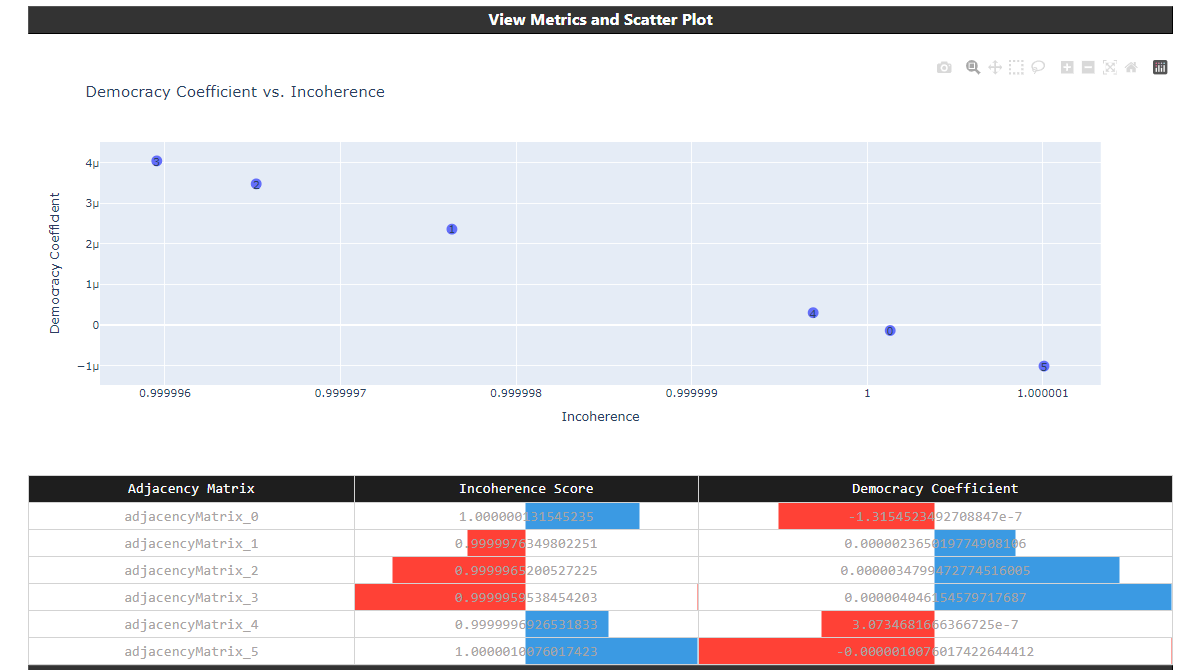
Democracy vs. Incoherence scatter plot reveals graph clusters
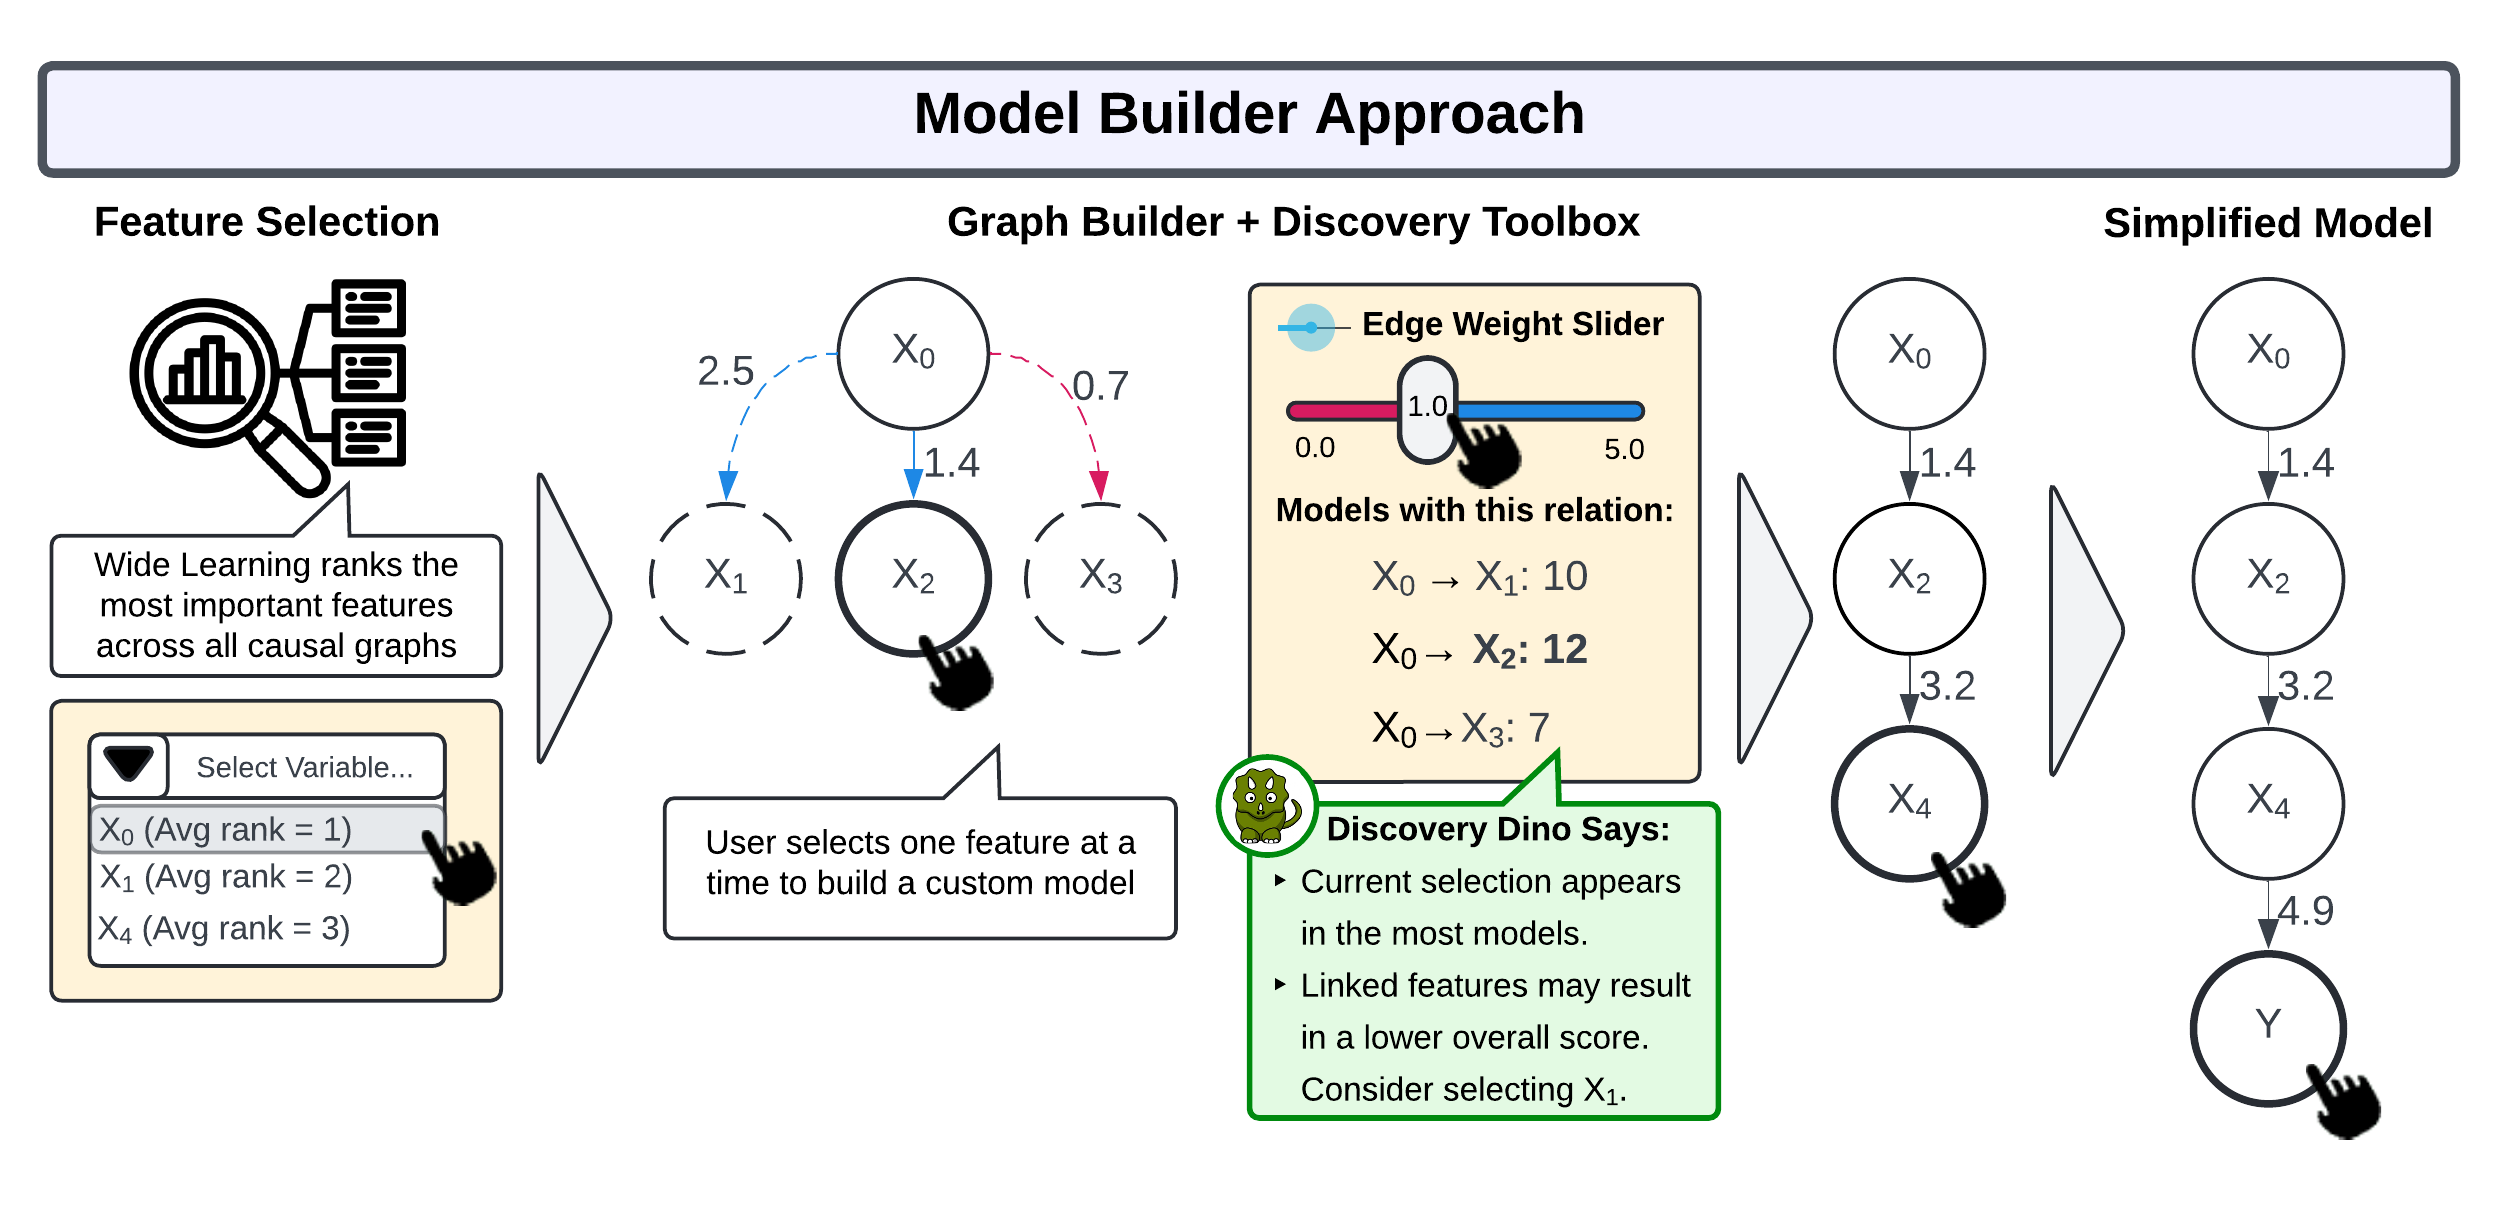
Feature 4: Model Builder for Guided Discovery
- Step-by-step exploration from parent to children nodes
- Path tracking and undo functionality
- Edge weight threshold filtering
- Child node preview on hover
Guided Discovery in Action
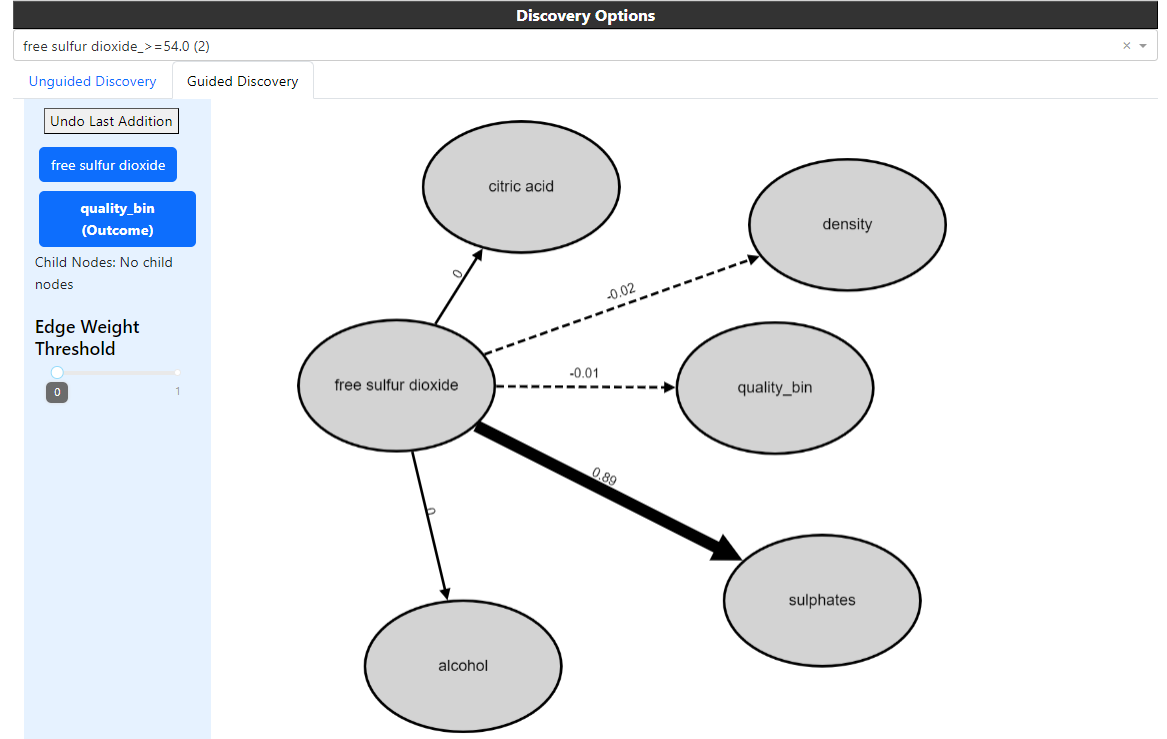
Building causal paths interactively
Path Tracking
Selected nodes form a clear causal path
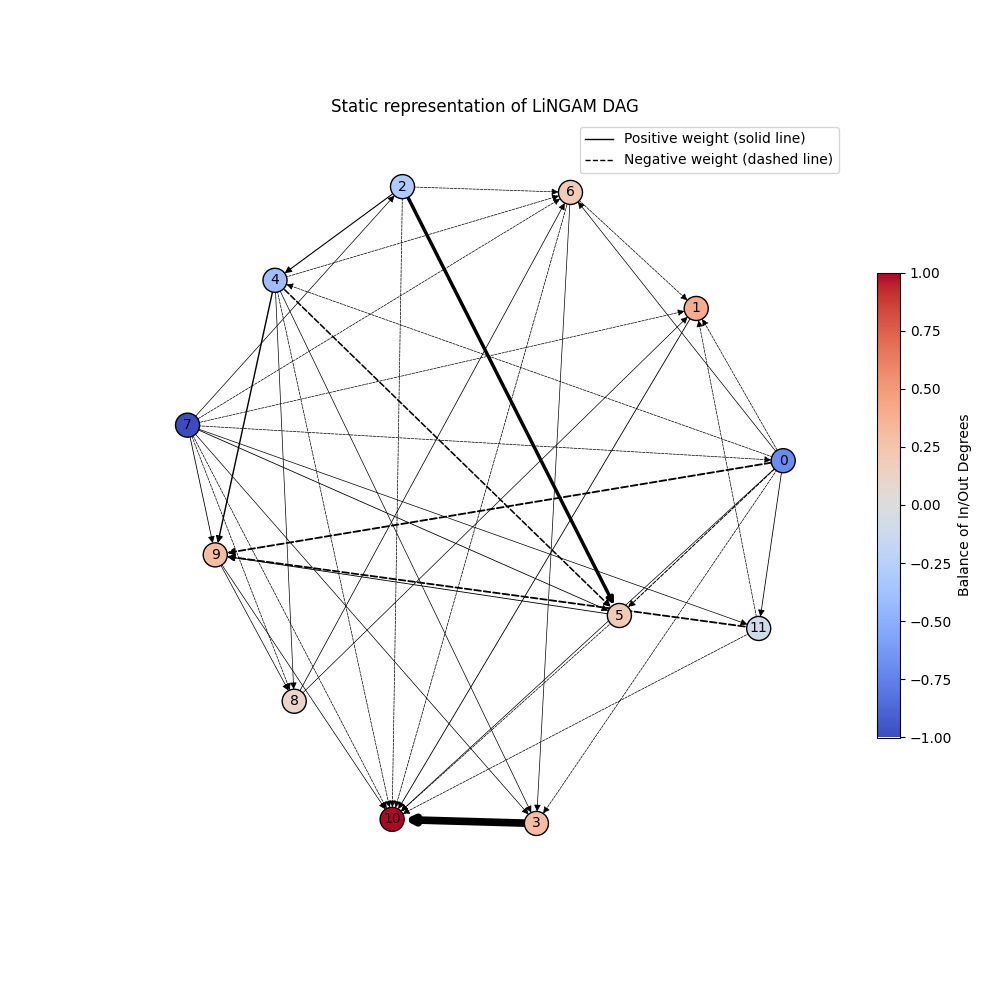
Feature 5: Model Builder - Unguided Discovery
Dynamic View
- Interactive graph manipulation
- Physics-based layout
- Node color = flux (in/out ratio)
- Edge style = direction & magnitude
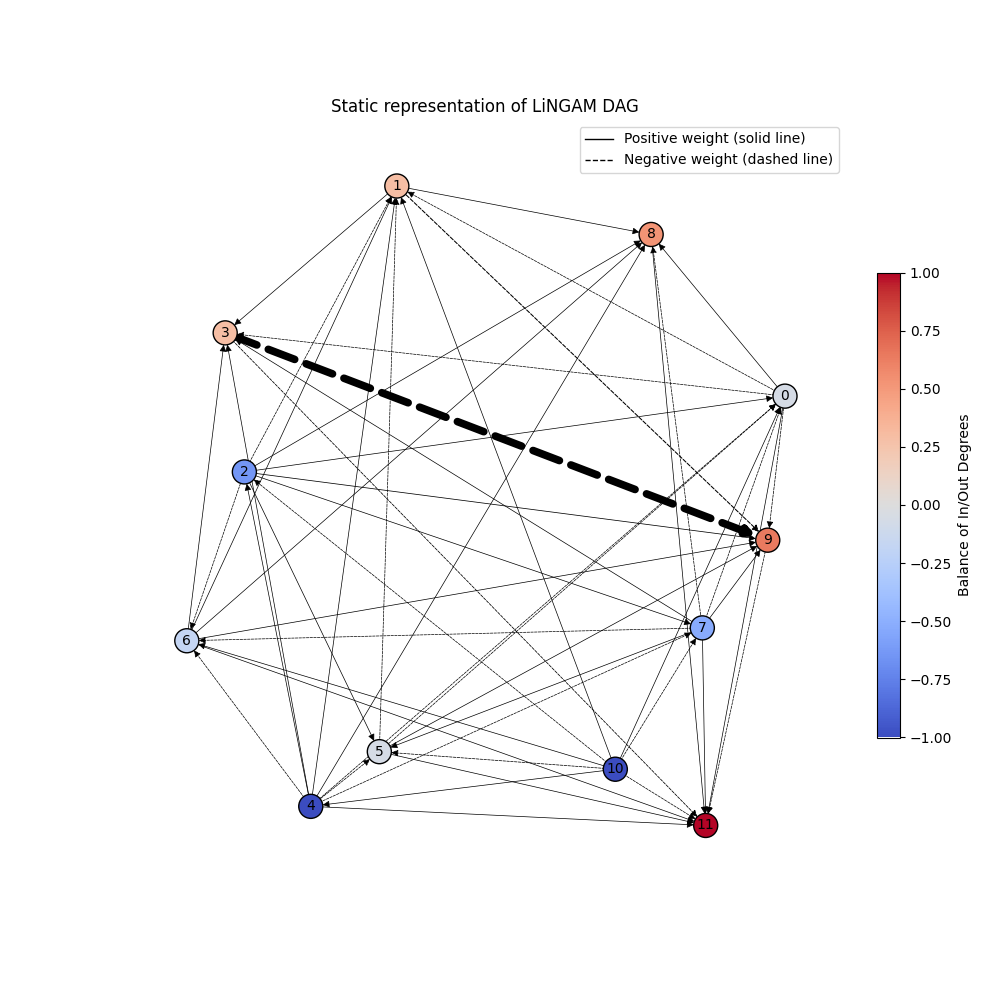
Static View
- Same visual encoding
- Exportable as image
- Easy sharing & comparison
Dynamic Graph View
Interactive exploration with full graph visibility
Static Graph View
Clean, exportable representation with color-coded nodes
Feature 6: Insights & Analysis
- Summary Statistics: Feature ranges, averages, modes for each condition
- Statistical Validity: CFI, AIC, RMSEA indices
- Recipe for Success: Actionable recommendations based on models
Statistical Validity
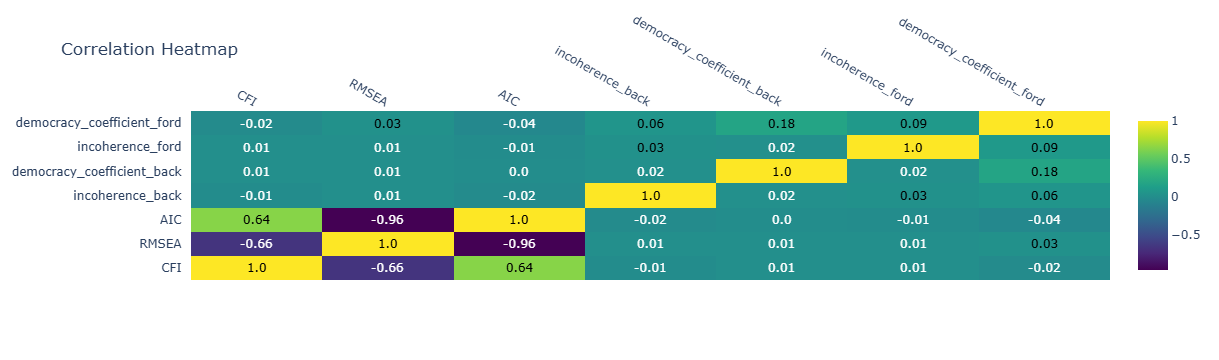
Quantitative details add convincingness to discoveries
Decision-Making Support
Translating causal discoveries into strategic actions
Real-World Applications
| Domain | Decision-Maker | Objective |
|---|---|---|
| Healthcare | Biopharmaceutical Firm | Determine causality between lung cancer resistance and genes for immunotherapy R&D |
| Manufacturing | Chemical Company | Understand causal relations among catalysts to develop new synthesis methods |
| Real Estate | Property Developer | Rank attributes influencing house value to guide development strategy |
| Food & Beverage | Manufacturer | Analyze determinants of product quality for QC protocols |
Future Directions
- Bootstrapping: Report which causal relationships are most supported across samples
- Learning by playing: Touchscreen, tablet, VR integration
- Model supplementation: Integrate latent variable models, handle confounding
- Generative AI themes: Customize interface design based on dataset domain
Research Extensions
- Prior Knowledge: Advanced identification techniques for chains, forks, and colliders
- Accessibility: Full WCAG compliance, multi-modal interaction
- Domain Expertise: Customized interfaces for different user types (scientists, managers, regulators)
- Statistical Enhancements: Automated model comparison and selection
Thank You!
Questions?
G-RIPS Sendai 2024
Fujitsu Causal Discovery Project
"Kaze ga fukeba, okeya ga moukaru"
When the wind blows, the barrel-makers profit.